By
Justin Wong
—
Results Section of a Research Paper: What to Include

Justin Wong
Head of Growth
Graduated with a Bachelor's in Global Business & Digital Arts, Minor in Entrepreneurship

The results section looks like the easy one. You have the output, you paste in the tables, you describe what happened. Then a reviewer asks why the percentages have no denominators and why an outcome you measured never appears.
Five failures, each with the fix underneath. All examples are invented for this guide as models.
<CTA title="Keep the numbers consistent from table to text" description="Draft your results with your sources and notes in the same workspace, so the figures in the text match the ones in the tables." buttonLabel="Try Jenni Free" link="https://app.jenni.ai/register" />
What goes in the results section of a research paper?
Reporting what you found, in a logical order, without interpretation. "Readmission fell by 8.1 percentage points" is a result. "This shows pharmacist review works" is a discussion.
The ICMJE Recommendations ask for results in logical sequence with the most important findings first, and warn against relying solely on statistical hypothesis testing, which fails to convey effect size and precision.
Failure 1. The percentage with no denominator
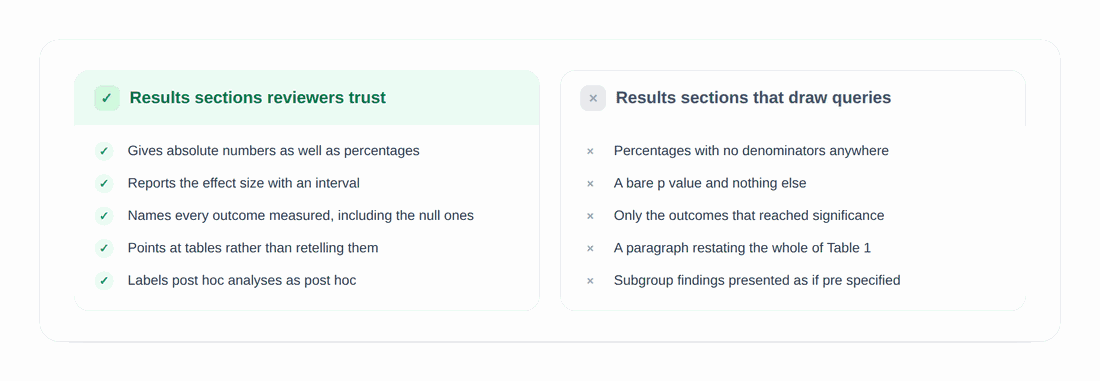
What gets written: The intervention group showed a lower readmission rate than controls (22.4% vs 30.5%).
What it should say: Readmission occurred in 91 of 406 patients (22.4%) in the intervention group and 124 of 406 (30.5%) in the control group, a risk difference of 8.1 percentage points (95% CI 2.1 to 14.1, p = .008).
ICMJE asks for numeric results not only as derivatives such as percentages, but also as the absolute numbers from which the derivatives were calculated. A reader cannot judge 22.4% without knowing whether it is 91 people or 9.
Failure 2. The p value doing all the work
A p value says nothing about how large the effect is or how precisely you estimated it. The American Statistical Association's 2016 statement sets out six principles, three of which matter here: p values do not measure the probability that the hypothesis is true, conclusions should not rest on whether a p value passes a threshold, and a p value does not measure the size of an effect.
Report the estimate, then its interval, then the p value. In that order, because the interval carries what a reader needs.
What you are reporting | Correct format | Common error |
An exact p value | p = .032 | p = 0.032, or only p < .05 |
A very small p value | p < .001 | p = .000 |
A correlation | r(58) = .42, p = .001 | r = 0.42, significant |
A confidence interval | 95% CI [1.2, 3.8] | 95% CI 1.2 to 3.8 with no level |
A mean and spread | M = 6.4, SD = 1.1 | mean 6.4 (1.1) |
A t test | t(238) = 9.11, p < .001 | t = 9.11, highly significant |
An effect size | d = 1.18 | a large effect |
Purdue OWL summarizes the two rules behind most of that table: report exact p values to two or three decimal places, and use a leading zero only when the statistic can exceed 1.
<ProTip title="🔢 Precision:" description="Never report p = .000. Software prints it when the value is smaller than its display precision, and it states something that is not true. Write p is less than .001 instead." />
Failure 3. The outcome that quietly vanished

Reporting only the outcomes that reached significance is selective reporting, and reviewers increasingly check the protocol or the registration to see what was left out.
Name every outcome you measured, in the order you pre specified them, and label post hoc analyses as post hoc. CONSORT asks explicitly for any other analyses performed, including subgroup and sensitivity analyses, distinguishing pre specified from post hoc.
Failure 4. The paragraph that retells Table 1
ICMJE asks authors not to repeat all the data in the tables in the text, and to emphasize or summarize only the most important observations. A paragraph listing every baseline characteristic is the most common way a results section becomes twice as long as it needs to be.
Point at the table instead. "Full baseline characteristics are in Table 1" is a complete sentence and it does the whole job.
Table, figure, or text?
The European Association of Science Editors gives the cleanest rule: tables when exact numerical values matter, figures to show comparisons or trends, and never the same data in both.
Table when a reader may want to look up a specific value, or when showing many variables at once.
Figure when the shape matters more than the value.
Text when there are three numbers or fewer. A two row table is usually a sentence in disguise.
Failure 5. The verb that interprets
Interpreting: demonstrating a clear benefit of pharmacist review. Emergency attendance also trended in the favorable direction.
Reporting: Emergency department attendance did not differ between groups (18.2% vs 20.4%, risk difference 2.2 percentage points, 95% CI -2.6 to 7.0).
Two things went wrong in the first version. "Demonstrating" is a discussion verb. And "trended in the favorable direction" describes a result that did not happen, which is the single most common form of spin in a results section.
<ProTip title="📊 Reporting:" description="Circle every verb in your results section. If any are demonstrates, proves, confirms or suggests, move that sentence to the discussion and replace it with the number it was hiding." />
How often published results carry errors
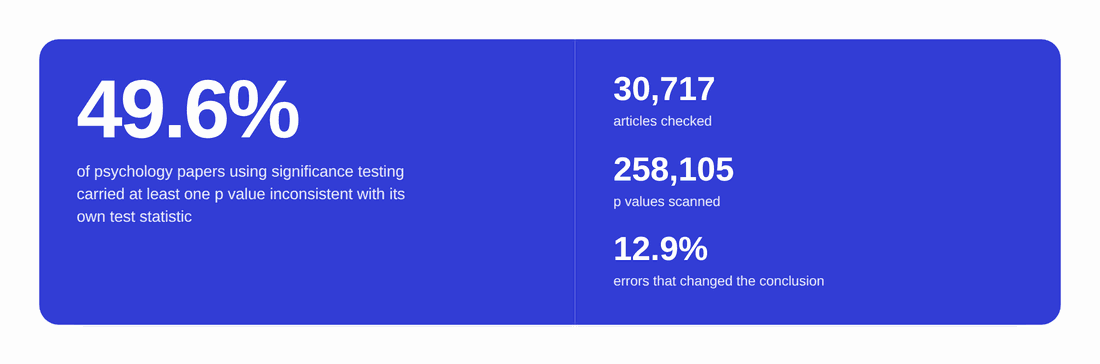
A study in Behavior Research Methods ran an automated check across three decades of psychology articles. Across 30,717 articles containing 258,105 p values, half of the papers using significance testing contained at least one p value inconsistent with its own test statistic and degrees of freedom. One in eight contained a grossly inconsistent value that may have affected the conclusion.
These are not fraud. They are transcription slips and numbers updated in one place but not another, which means they are catchable in minutes.
<ProTip title="🧮 Check the math:" description="Read your results against your output file line by line, not from memory. Almost every one of those inconsistencies started as a copy error." />
Drafting results with Jenni
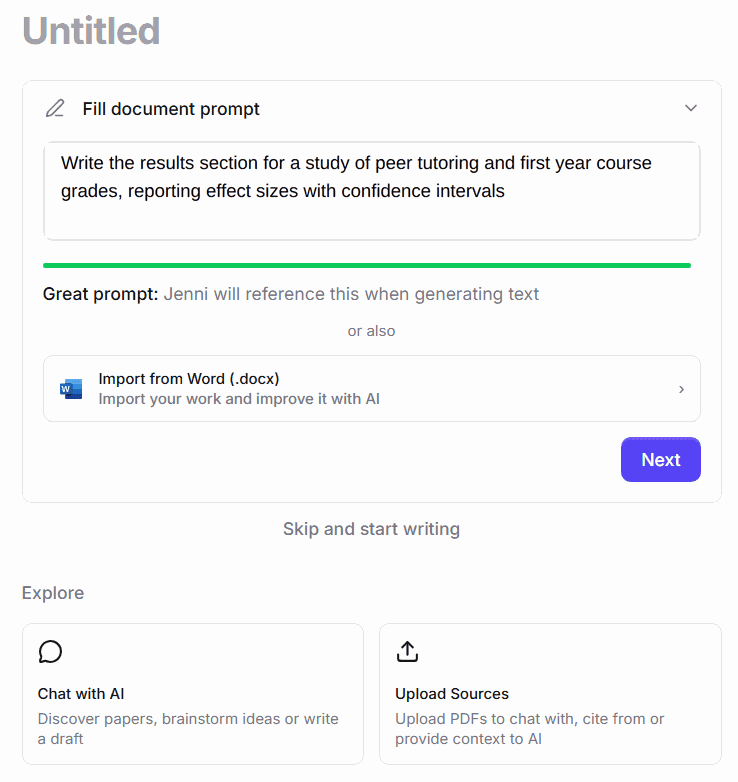
Describe the section in the prompt. Name the study and say you want effect sizes with intervals, so the reporting convention is set from the start.
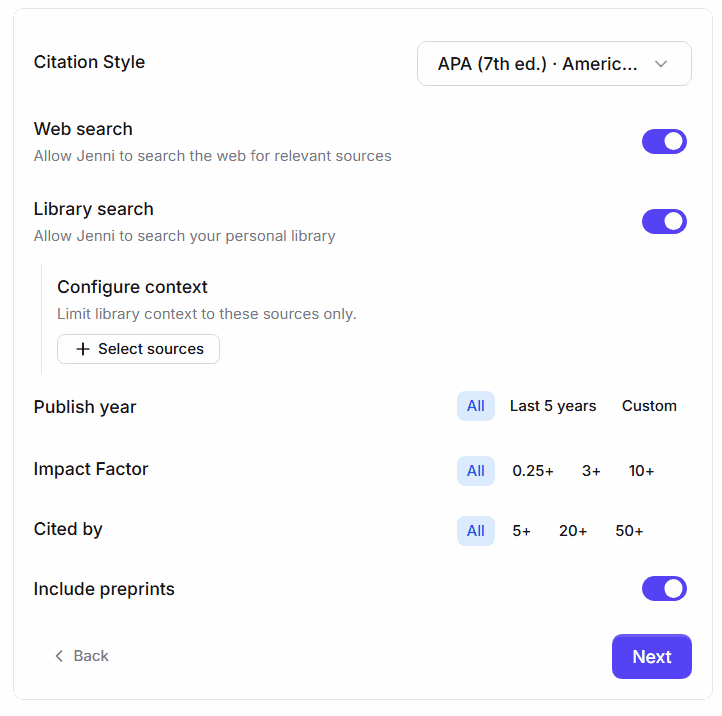
Set the citation style. Statistical formatting conventions travel with the style.
Generate the structure. Standard IMRaD headings, so results sit in their own section and interpretation has somewhere else to go.
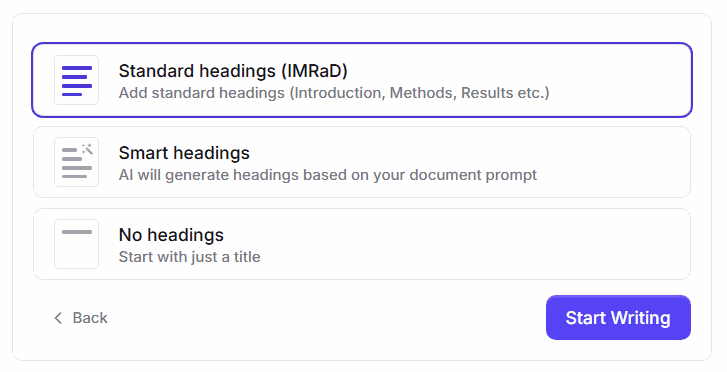
Then draft outcome by outcome: primary first, secondary in the order you pre specified them, subgroups clearly labeled. Run Proofread for formatting slips in the statistics and Claim Confidence for sentences where reporting turned into arguing. Both sit in the review pass.

The consistency pass
Fifteen minutes, and it catches all five failures.
Every percentage in the text has its denominator beside it.
Every effect has an interval, including the null ones.
Every outcome named in your methods appears somewhere in your results.
No paragraph restates a table you have already pointed at.
No verb in the section interprets.
Every number in the text matches the table it came from.
<ProTip title="🚦 Order:" description="Write the results in the order your methods introduced the outcomes. If a reader has to hunt for the primary outcome, the ordering is wrong however interesting the other findings are." />
Let the Numbers Do the Talking
A good results section is the least persuasive part of your paper on purpose. You report what happened, in the order you said you would measure it, with enough precision that a careful reader could disagree with your discussion and still trust your data. That restraint is what makes the discussion credible when it arrives.
<CTA title="Check the reporting before a reviewer does" description="Run Proofread and Claim Confidence over the draft to catch the sentences where reporting turned into arguing." buttonLabel="Score My Draft" link="https://jenni.ai/cfp-review" />
For the section that follows, see our guide to the discussion section of a research paper, and for summarizing all of it, writing a conference abstract. If the paper is still forming, drafting against your own sources keeps the numbers close to where they came from.