By
Justin Wong
—
How to Conduct a Meta Analysis Step by Step

Justin Wong
Head of Growth
Graduated with a Bachelor's in Global Business & Digital Arts, Minor in Entrepreneurship
A meta-analysis takes results from many studies and combines them into one stronger result. It's a key research method, particularly in medicine and psychology.
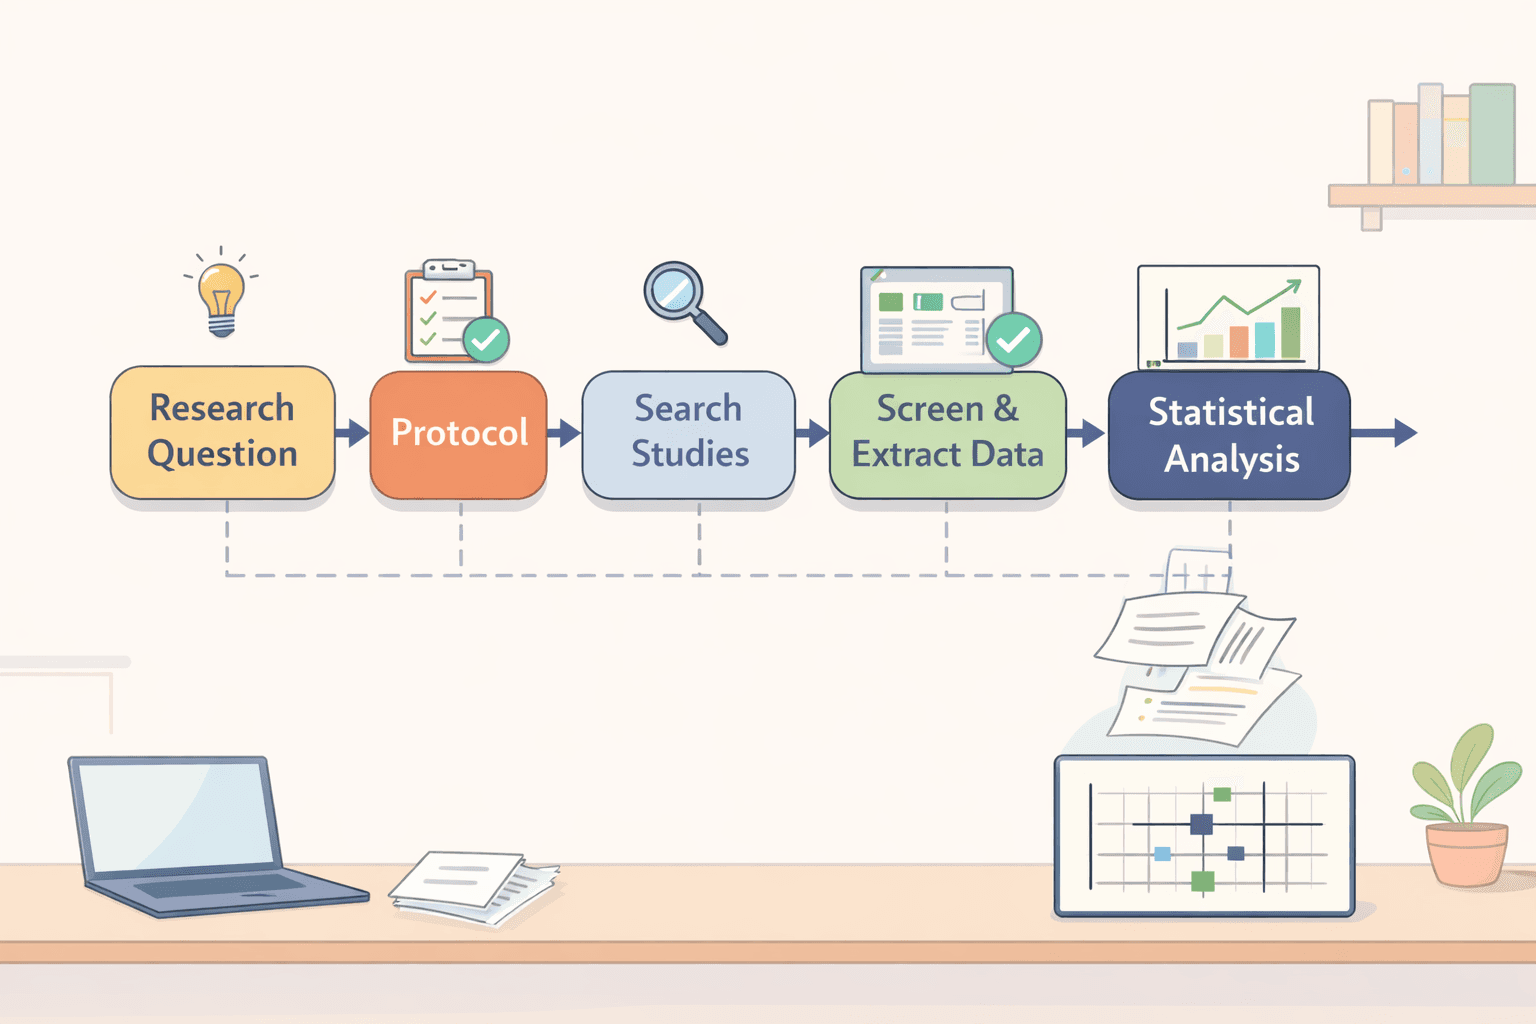
This guide covers the whole process, start to finish. We'll go from forming your research question all the way to making sense of the final numbers. You'll also get a look at the tools you need and the typical errors to watch out for. If you're drafting the review narrative alongside the quantitative synthesis, the AI Literature Review & RRL Generator can help you organize sources and write up the background.
<CTA title="Plan Your Meta Analysis Clearly" description="Structure your research workflow with guided AI outlines and clear steps" buttonLabel="Try Jenni Free" link="https://app.jenni.ai/register" />
What Is a Meta Analysis and Why It Matters
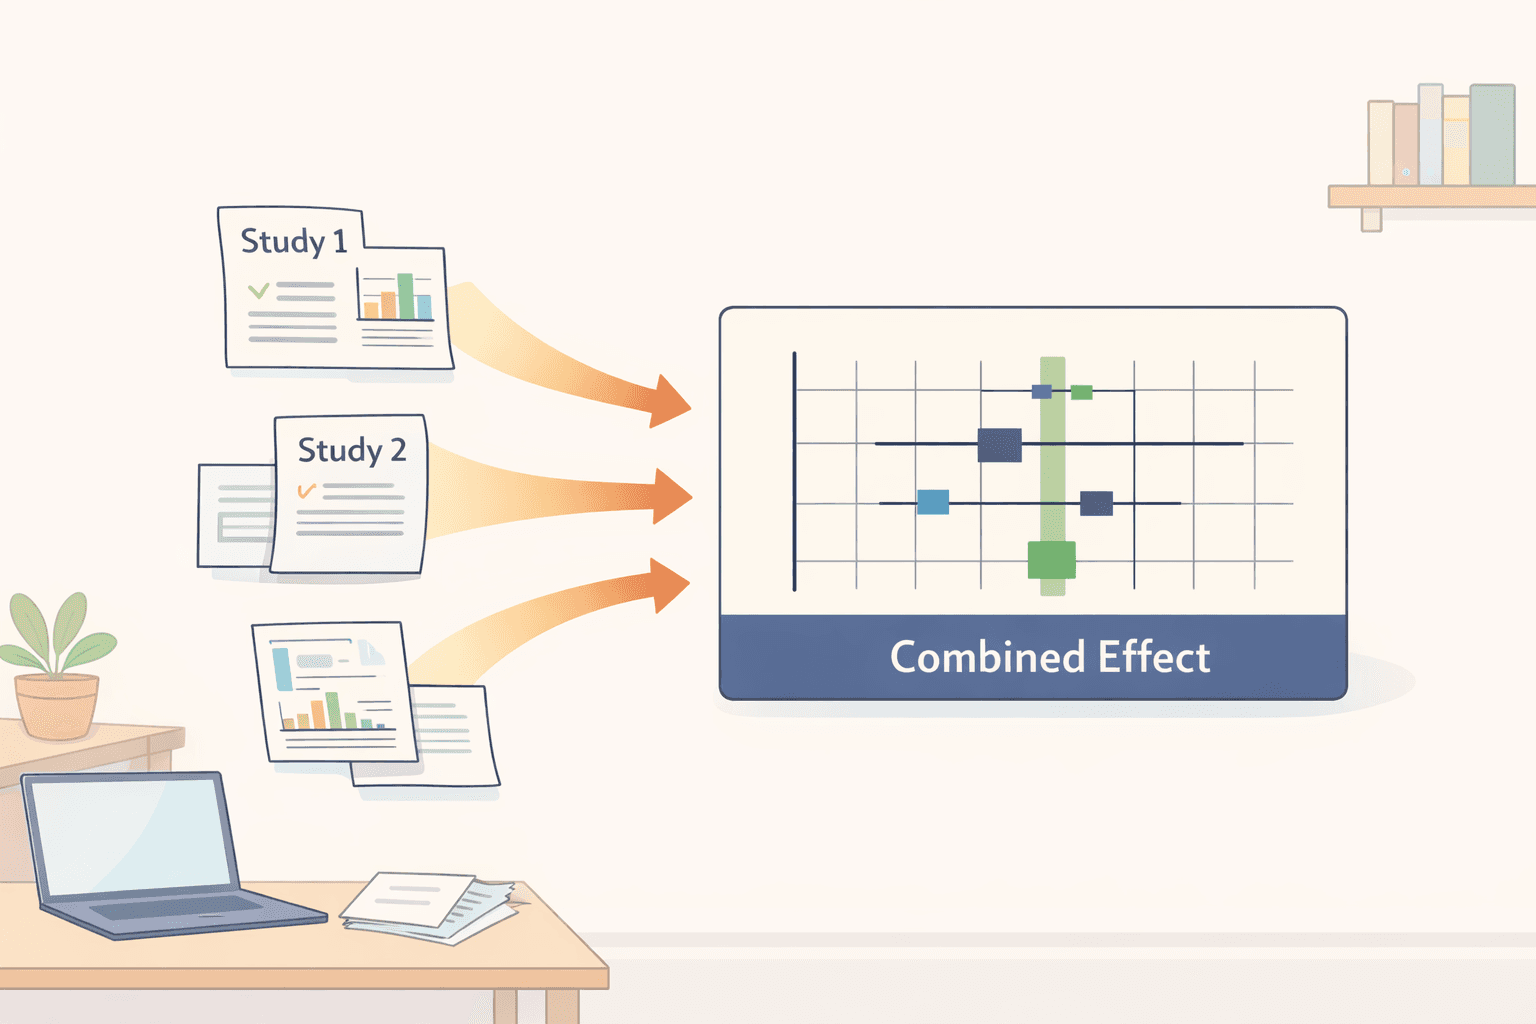
A meta-analysis is a method for merging the data from several research studies. By doing this, it creates a single, more powerful result. The larger combined sample size makes the findings more robust and less prone to chance.
The Cochrane Handbook states that this synthesis of data across studies produces more reliable evidence than any single study can.
A helpful overview of how systematic reviews and meta-analyses work together can be found in this guide on systematic reviews and meta analyses.
The technique is common in several fields:
Medicine
Psychology
Education research
In simple terms, it's like taking many small experiments and turning them into one big, more trustworthy study.
<ProTip title="💡 Pro Tip:" description="Meta analysis is only useful when studies measure similar outcomes" />
Step 1: Define a Clear Research Question
Everything in a meta-analysis depends on the starting question. If it's vague, the whole project will be unfocused from the beginning.
A good way to build your question is with the PICO framework. This breaks it down into four parts:
Population
Intervention
Comparison
Outcome
For example: "Does [Drug X] lower blood pressure more than a placebo in adults over 50?"
Getting this right is critical. Your exact question decides which studies you search for, what information you pull from them, and how you run the analysis. A fuzzy question means you'll gather inconsistent data, and the final conclusion won't be strong.
Step 2: Develop and Register a Protocol
Before you collect a single piece of data, you need a plan. This plan is called a protocol. It's a detailed document that locks down your methods in advance. The main goal is to prevent bias, it stops you from changing your approach later to get a nicer result.
Your protocol should clearly state several key things:
Your specific research question
The exact rules for which studies you will include or exclude
Your complete strategy for searching the literature
The statistical methods you plan to use for analysis
It's a good practice to register this protocol on a public platform like PROSPERO. This makes your entire process transparent for anyone to see.
There are concrete reasons to do this work up front. It prevents "cherry-picking" of results, makes it possible for other researchers to repeat your work, and gives your final analysis much more credibility.
If you’re still building your foundation, reviewing a narrative literature review can help you understand how research context is structured before moving into systematic methods.
<ProTip title="📌 Pro Tip:" description="Write your protocol before searching for studies to avoid bias" />
Step 3: Conduct a Systematic Literature Search
The quality of a meta-analysis rests on finding all the relevant studies. A partial or biased search will skew the final answer.
You need to look in the right places. Major databases are essential:
PubMed
Scopus
Web of Science
Google Scholar
Don't just stop at published journal articles. You should also search for "grey literature," like unpublished theses, conference papers, and study registries, to avoid publication bias. For a fuller walkthrough of the review workflow that typically comes before the statistics, see this step-by-step systematic literature review guide.
Building an effective search requires a strategy. You'll use specific keywords, combine them with Boolean operators (AND, OR), and often employ a database's controlled vocabulary, such as MeSH terms in PubMed.
To structure this process effectively, you can follow a how to write literature review outline to organize search terms and inclusion logic.
For instance, a search might look like: "hypertension" AND "randomized controlled trial" AND "antihypertensive agents".
This step is critical because if you miss important studies, your combined result can be completely wrong. A thorough, documented search is your best defense against this.
Step 4: Screen and Select Studies
Once your search is done, you'll have a large list of potential studies. The next job is to filter them down using the strict rules you set in your protocol.
This happens in two main stages. First, you quickly review all the titles and abstracts. Then, for the studies that seem relevant, you get and read the full text.
At each step, you apply your pre-defined inclusion and exclusion criteria to decide what stays and what goes. What are common criteria?
The type of study design is usually first, many meta-analyses only include randomized controlled trials. Other rules might involve a minimum sample size, the specific way outcomes were measured, or the population studied.
It’s considered best practice to have two people do this screening independently. This cuts down on personal bias. When the two reviewers disagree on a study, they discuss it to reach a consensus.
The entire screening process should be documented visually, often using a PRISMA flow diagram. This chart shows exactly how many studies were found, removed, and why, making your method transparent.
Step 5: Extract and Organize Data
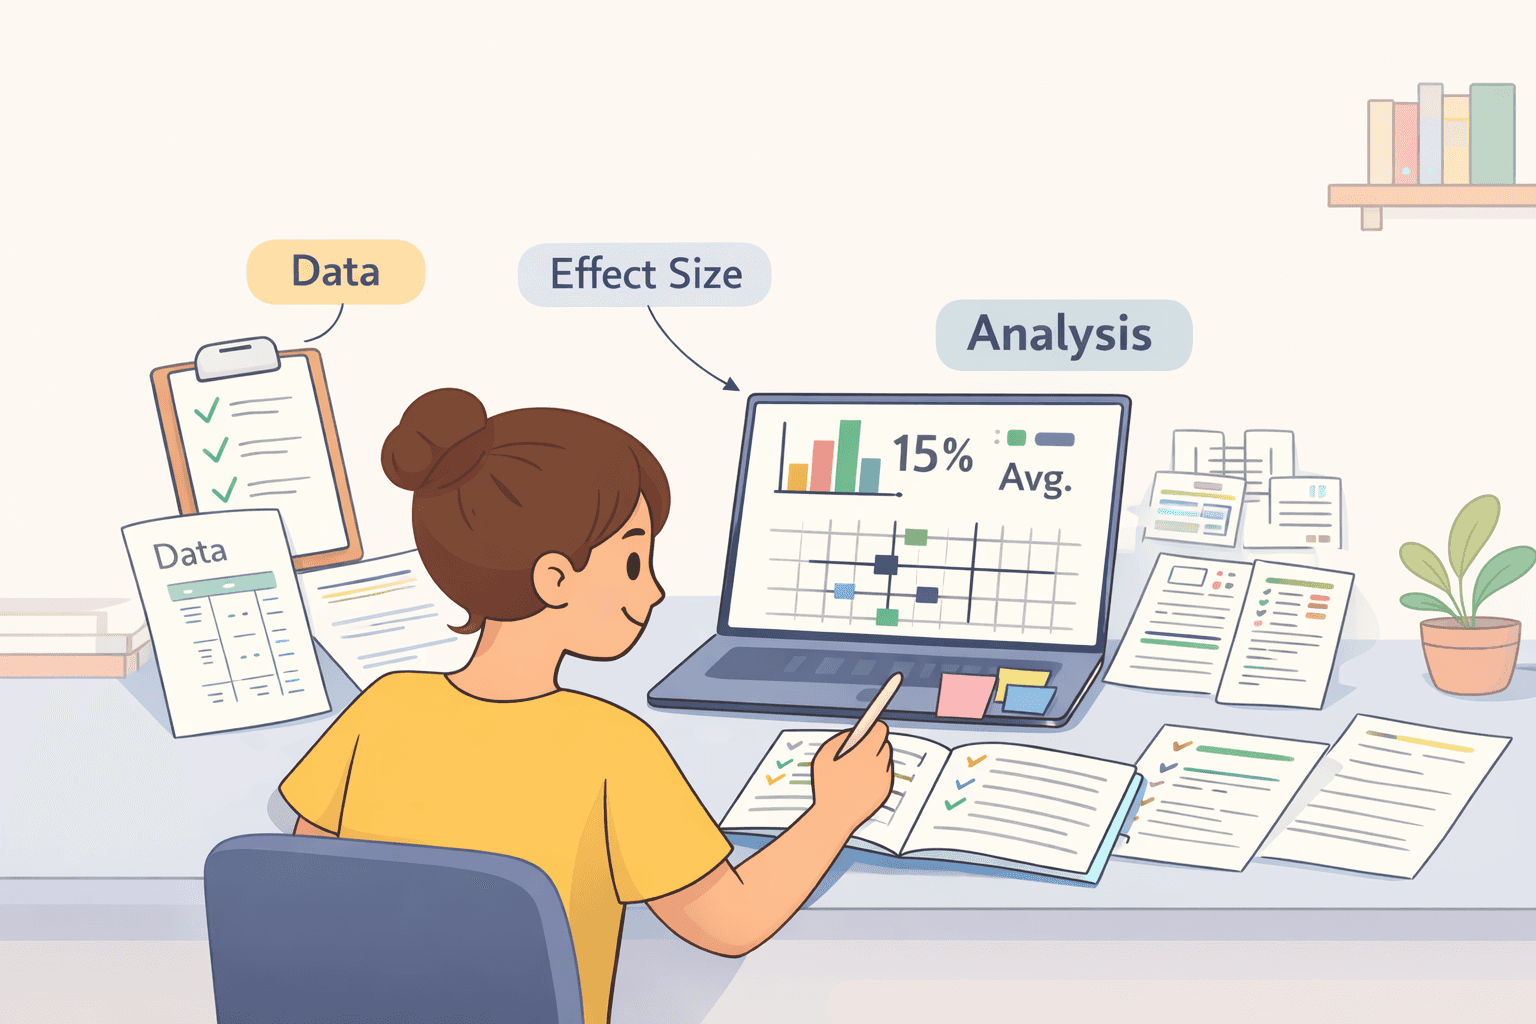
This is the manual work. You go into each included study and pull out the specific numbers you need for your calculations. It turns pages of research into a structured dataset.
You're typically looking for a few key pieces of information from every study:
The sample size for each group
The means and standard deviations for your outcome
A calculated effect size (like a Cohen's d or an odds ratio)
Basic study characteristics (year, design, population)
A deeper explanation of how these data points are used in real research can be found in this article on meta analyses in clinical research, which walks through practical applications and interpretation.
You'll organize this into a table or spreadsheet. For example:
Study | Sample Size | Effect Size |
Study A | 100 | 0.5 |
Study B | 150 | 0.7 |
Getting this right is non-negotiable. A simple typo or misread number here will flow directly into your analysis and distort the final result. That's why using a standardized form and having a second person verify the extracted data is so important.
<ProTip title="🧠 Reminder:" description="Use standardized forms to keep data extraction consistent" />
Step 6: Assess Study Quality and Bias
You can't assume every study you found is well-conducted. This step is about judging the internal trustworthiness of each piece of evidence you're about to combine.
Researchers use standardized tools to make this assessment consistent. Common ones are the Cochrane Risk of Bias tool (for randomized trials) and ROBINS-I (for non-randomized studies).
These tools guide you to check for specific problems that can skew a study's results, such as:
Selection bias: How were participants assigned to groups?
Measurement bias: Was the outcome measured fairly for everyone?
Reporting bias: Did the authors hide unfavorable results?
What do you do with this information? Studies judged to have a high risk of bias are problematic. They might be excluded entirely, or more commonly, their influence is tested. A sensitivity analysis reruns the main results without these weaker studies to see if the conclusion changes.
Step 7: Perform Statistical Analysis
Here's where the numbers from all your studies are combined into a single result.
First, you choose the right statistical measure, or effect size, for your data. Common ones are the odds ratio (for yes/no outcomes), the risk ratio, or the standardized mean difference (for comparing averages).
Next, you pick a statistical model. A fixed-effect model works if you believe all the studies are estimating one true effect. A random-effects model is more common; it allows for the idea that the true effect might vary a bit from study to study.
A classic explanation of these statistical principles can be found in this resource on meta analysis principles and procedures, which details how results are combined and interpreted.
A crucial part of the analysis is checking heterogeneity, basically, how much the study results disagree with each other. The I² statistic quantifies this. A value below 25% suggests low disagreement, while a value over 50% indicates high disagreement.
If your I² is high, it means the studies are giving very different answers. Your combined result still has meaning, but you must interpret it with caution and explain the variability.
Step 8: Create and Interpret Visual Outputs
The results of a meta-analysis are usually shown in pictures. This isn't just for decoration. It makes the dense statistical findings clear and immediate for anyone reading the report.
Forest plots This is the most common chart you'll see. A forest plot does a few things at once:
It displays the effect size and confidence interval from each individual study included in the analysis.
It shows the combined, or "pooled," effect size from all those studies put together.
The visual layout lets you quickly see which studies agree, which are outliers, and how precise the overall finding is.
Funnel plots Researchers use this type of plot to check for a specific problem: publication bias. This is the tendency for studies with positive or dramatic results to get published more often than studies with negative or boring results.
A symmetrical, inverted funnel shape suggests this type of bias is minimal.
If the plot looks lopsided or has gaps, it’s a red flag that important data might be missing from the analysis, which could skew the final conclusion.
Why visuals matter Put simply, a well-made chart can communicate in seconds what might take paragraphs of text to explain. They transform columns of numbers into a story that's easier to grasp, question, and trust.
<ProTip title="📊 Pro Tip:" description="Use forest plots to quickly communicate overall findings" />
Step 9: Conduct Advanced Analyses
The basic combined result from a meta-analysis is useful, but it's rarely the whole story. To get a clearer, more detailed picture, researchers run advanced analyses. These techniques test the robustness of the findings and dig into the "why" behind the numbers.
Common methods
Subgroup analysis: This splits the data into categories. You might compare results from studies on men versus women, or studies using a high dose versus a low dose. It answers the question, "Does the effect change for different types of people or under different conditions?"
Sensitivity analysis: Here, you check how sturdy your main finding is. What happens if you remove the largest study? Or exclude studies with a high risk of bias? If the conclusion flips, your original result is fragile. If it holds steady, you can be more confident in it.
Meta-regression: This is a more statistical approach. Instead of just grouping studies, it tries to model how a specific study characteristic, like the average age of participants or the year it was published, is quantitatively related to the effect size.
Example use Imagine your meta-analysis finds that a new tutoring program helps students. A subgroup analysis could reveal it only helps high schoolers, not middle schoolers.
A sensitivity analysis might show the result depends entirely on one poorly designed study. Meta-regression could indicate that the program's effectiveness decreases slightly each year it's been running.
These analyses don't just combine data; they interrogate it. They help explain why study results vary and tell you exactly where, and for whom, the evidence is strongest.
Step 10: Report Your Findings Clearly
A well-conducted meta-analysis can be undone by a poorly written report. Clear, structured reporting is what makes your work credible, useful, and trustworthy for other scientists.
Follow PRISMA guidelines Most researchers now use the PRISMA framework. It’s a checklist for what to include. If you're still clarifying the distinction between review types before reporting, this guide on meta analysis vs systematic review helps ensure your structure and terminology are accurate.
Flow diagram: A visual map showing how you went from searching thousands of records to including the final handful of studies. It documents every decision.
Study tables: Organized summaries of each included study’s design, participants, and key results.
Statistical results: The pooled effect sizes, confidence intervals, and tests for heterogeneity, all the numbers from your analysis.
Limitations: An honest discussion of your review’s weaknesses, like potential publication bias or low-quality source studies.
Using PRISMA isn't just a formality. It forces you to show your work, which lets others evaluate it properly and even repeat it if they want to.
Writing tips
Be concise. Get to the point.
Explain your methodology section with enough detail that someone else could follow them.
Stick to what your data actually shows. Don't overstate the conclusions or speculate beyond the evidence.
Common Challenges and How to Handle Them
Let's be honest: doing a meta-analysis is hard. It's a technical, time-consuming process, and it's normal to hit roadblocks, especially when you're starting out.
Frequent challenges
Handling missing data: It's common. Authors might not report the exact numbers you need. You'll have to contact them, make estimates, or sometimes exclude the study entirely.
Managing heterogeneity: When your included studies show wildly different results, combining them feels wrong. You need to figure out if the variation is acceptable or if it invalidates the whole analysis.
Learning statistical software: Spreadsheets won't cut it. You need specialized tools, and their learning curve is steep.
Practical solutions
Use the right tools: Software like R (with packages like metafor or meta) or RevMan is built for this. They handle complex calculations.
Start small: Don't try to synthesize fifty studies on your first attempt. Practice with a focused question and a manageable set of five or ten papers.
Get help: Consult with a statistician or an experienced colleague early. It can save you months of frustration.
Reality check A proper systematic review and meta-analysis isn't a weekend project. It's a major research undertaking.
Most teams report it takes anywhere from three months to a full year to do it well. The process demands patience, careful organization, and a willingness to learn as you go.
<ProTip title="⚠️ Pro Tip:" description="Do not rush statistical analysis accuracy matters more than speed" />
Tools for Conducting a Meta Analysis
Your choice of software can make the process much smoother or much harder. The right tool handles the complex statistics so you can focus on the science. If you're also managing a large library of PDFs and citations during screening and extraction, the Zotero and Mendeley integration for researchers can help keep everything organized.
Popular software
R (with the metafor or meta packages)
RevMan (from Cochrane)
Stata
Comprehensive Meta-Analysis (CMA)
Quick comparison
Tool | Cost | Best For |
R | Free | Advanced users, full customization |
RevMan | Free | Beginners, Cochrane-style reviews |
Stata | Paid (license) | Professional research teams |
CMA | Paid (license) | Researchers who prefer a point-and-click interface |
None of these are instantly easy. Each has its own learning curve. If you're new to this, starting with a simpler, guided tool like RevMan is often the best way to build confidence before tackling more powerful options.
How to Conduct a Meta Analysis Successfully
Conducting a meta-analysis requires structured planning, careful data handling, and clear reporting. Each step builds on the previous one, forming a reliable research process.
<CTA title="Turn Research Into Clear Writing" description="Organize complex meta analysis workflows into structured papers easily" buttonLabel="Try Jenni Free" link="https://app.jenni.ai/register" />
By following a step-by-step approach, you can produce accurate and meaningful results. Tools like Jenni support this process by helping you structure ideas, stay organized, and communicate findings clearly.