By
Justin Wong
—
A Clear Guide to Writing the Methodology Section of Your Research Paper

Justin Wong
Head of Growth
Graduated with a Bachelor's in Global Business & Digital Arts, Minor in Entrepreneurship

The methodology section is where you show exactly how your study was carried out and why each decision fits your research goals. It explains your design, tools, participants, and procedures in a way that helps readers judge the quality and reliability of your work.
This guide breaks down each part of the methodology so you can write it with clarity and confidence. You’ll learn how to describe your research design, outline your steps, and present your data analysis. Justify your choices without overcomplicating the process. Whether you’re working on a thesis, dissertation, or journal article, this section sits alongside other core components — see our breakdown of the essential parts of a research paper — the structure here will help you stay organized.
<CTA title="Write a Clear Research Methodology Fast" description="Use outline based prompts to build a structured, reviewer ready methods section with ease" buttonLabel="Try Jenni Free" link="https://app.jenni.ai/register" />
1. Start With a Clear Overview of Your Study Design
Readers need a quick picture of what kind of study they are looking at. That is why your methods section should start with a short overview of your study design. Think of this as a map in one paragraph.
In this design overview, you should briefly state:
Research type: Qualitative, quantitative, or mixed methods.
Philosophical or theoretical approach: For example: positivist, constructivist, pragmatic, interpretive.
Timeframe: Cross-sectional, longitudinal, case study, or another time-based frame.
Setting or environment: Such as a school, clinic, online platform, lab, or community.
Core purpose: What you were trying to find out or understand in simple terms.
A good overview does not go into long detail. It gives just enough so that, when readers move into the next sections, they already understand the basic logic behind your choices.
Choosing the Right Research Design
The design should match the question you’re asking. This relationship can be briefly explained in one or two concise sentences.
The approach you choose depends on your research question.
Quantitative designs work best when you want to:
Measure variables
Test hypotheses
Examine relationships using statistics
Qualitative designs are better when you want to:
Explore experiences or meanings
Understand how people make sense of events
Study processes in depth rather than numbers
Mixed methods designs are useful when:
You want both numerical trends and rich stories
You need one type of data to help explain the other
You can model your own sentences after these examples:
Quantitative:
“This study used a quantitative, cross-sectional survey design to examine predictors of academic burnout among first-year university students.”
Qualitative:
“A phenomenological approach was adopted to explore how caregivers interpret and manage emotional fatigue while providing end-of-life care.”
Mixed Methods:
“The research used an explanatory sequential mixed methods design beginning with a large-scale survey followed by targeted interviews with selected respondents.”
<ProTip title="💡 Pro Tip:" description="Begin your methodology by summarizing your entire research approach in one tight paragraph before expanding into specifics" />
Why This Matters
A concise design overview ensures readers understand the structure of your study before they encounter technical details. It also signals that your method logically matches your research aims, which is a key part of academic evaluation.
2. Describe Your Participants or Data Sources
After the design, readers want to know who or what you studied. This section explains your participants or data sources and why they were a good fit for your research question.
Participant-Based Studies
If your research involves people, start by saying who the target group is and why they fit your question. Then give concrete details, not vague labels.
You should include:
Total sample size - How many participants took part in the study?
Sampling method - How you chose them (for example: random, purposive, convenience).
Demographic information - Age range, gender, occupation, location, or other relevant traits.
Inclusion and exclusion criteria - Who was allowed in and who was not, and why.
Recruitment strategy - Where and how you found participants.
Always explain why you chose a certain sampling method. Reviewers look closely at this point because sampling affects validity and fairness.
Sampling Techniques (Mini Guide)
Sampling choices change how well your results can be trusted or generalized. Here are common methods in a simple format:
Sampling Method | Description | Ideal Use Case |
Simple random sampling | Equal chance for all members | Large quantitative studies |
Systematic sampling | Every nth person selected | Populations with complete lists |
Stratified sampling | Divided into subgroups first | Studies needing demographic balance |
Cluster sampling | Groups selected instead of individuals | Geographically dispersed samples |
Purposive sampling | Researcher-selected based on traits | Expert-heavy qualitative work |
Snowball sampling | Participants recruit others | Hidden or sensitive populations |
Convenience sampling | Easiest available participants | Student projects & pilot studies |
Inclusion and Exclusion Criteria
Make it clear why your boundaries exist. One short sentence can anchor this, then you move into specifics.
Example:
“Inclusion criteria required participants to have at least six months of remote working experience. Individuals with exclusively hybrid schedules were excluded to maintain focus on full-time remote workers.”
Recruitment Strategy
Describe how you found and invited participants so another researcher could try to do something similar. You might mention:
Campus email lists or notice boards
Social media groups or online forums
Clinic or hospital units
Community centers or organizations
Online crowdsourcing platforms
Give enough detail for the process to be clear, but do not reveal any personal identities.
For Non-Human Data Sources
Some studies do not involve people at all. If that is true for your work, say so clearly and explain your data sources instead.
You might have used:
Archival documents or records
Organizational reports
Public datasets or statistics
Historical texts or media content
Chemical or environmental samples
Technological or biological systems
For these, explain:
Where the data came from
How you accessed it
How you chose which items to include
Any rules for including or excluding data
<ProTip title="📌 Reminder:" description="Always describe your selection criteria before the number of participants to make your logic clear" />
3. Detail the Materials, Tools, and Instruments
The next question readers ask is: What did you use to collect and measure your data? This section describes your materials and instruments so others can judge if your tools were accurate, fair, and suitable.
You can organize this section by tool type.
Common Material Categories
Follow that orientation with a list and brief context for each category.
Surveys or questionnaires
Mention whether they were researcher-made or validated tools, plus reliability statistics if available.Interview guides
Provide a short explanation of how questions were developed, aligned with the research question, and piloted.Laboratory instruments
Include models, measurement accuracy, calibration steps, software integrations, and chemical purity standards.Software tools
Examples:
SPSS, STATA, R
NVivo, Atlas.ti, MAXQDA
MATLAB
Python libraries (NumPy, SciPy, pandas)
Qualtrics or SurveyMonkey
Example paragraph:
“Anxiety was measured using the Generalized Anxiety Disorder Scale (GAD-7), a validated 7-item tool widely used in clinical and population-based studies.”
Explain Why You Chose These Tools
Your readers should never be left wondering, “Why that instrument and not another?” So add a short justification, and connect your choices to prior studies in the literature review section of a research paper.
Example:
“These tools were selected due to their established reliability in previous studies examining stress and health outcomes.”
Why This Matters
Well-described tools help readers trust your data and evaluate your study’s reliability. They also allow future researchers to replicate your methods more precisely.
<ProTip title="💡 Note:" description="When using standardized instruments, cite the original publication to confirm validity" />
4. Explain the Procedures Step-by-Step
This is typically the longest section of the methodology because it describes exactly what happened in the study. The key is chronological clarity.
What Your Procedures Section Should Cover
A clear procedures section should outline:
The sequence of steps in your study
The length of each major stage
How any interventions were given or applied
How you obtained informed consent
What instructions participants received
How you handled, stored, and cleaned data
Any adjustments made when things did not go as planned
A Chronological Example
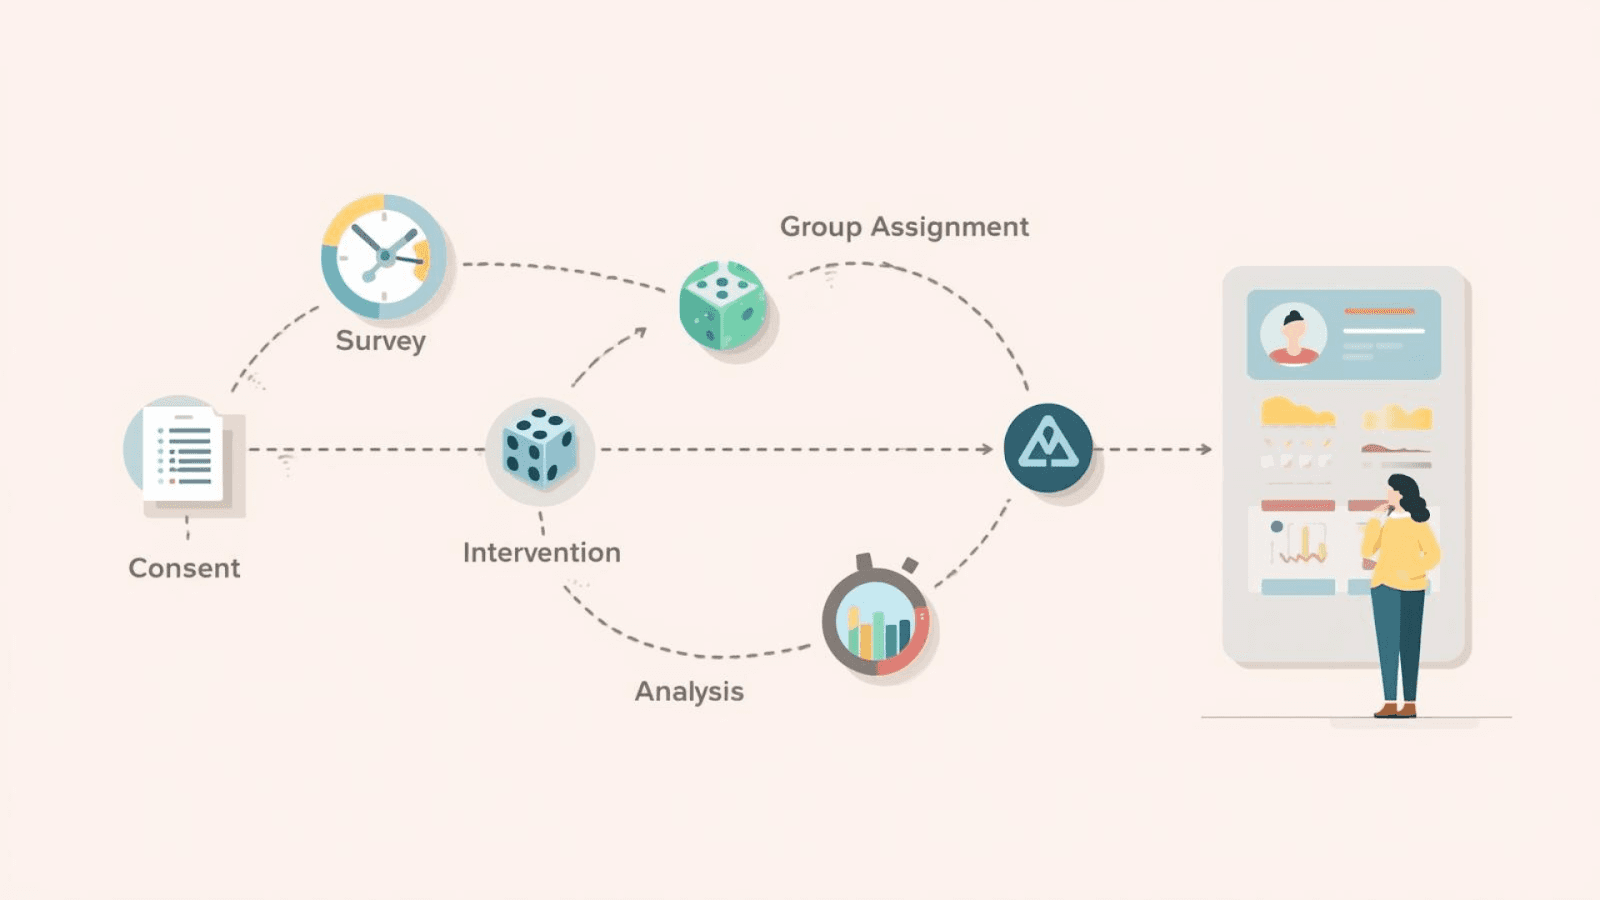
Preface the example with a one-line orientation, then show the chronology.
Initial emails containing the survey link were sent to all eligible participants.
Participants accessed the digital consent form and agreed electronically.
They completed a baseline questionnaire capturing demographics, mood, and sleep habits.
Participants were randomly assigned to a control or experimental group using a computer-generated sequence.
The intervention group attended weekly 45-minute mindfulness sessions for four weeks.
Experimental Research
For experiments, details matter a lot because they affect internal validity. Make sure you explain:
The randomization method
Any blinding or double-blinding used
What the control group did or received
The dose, duration, and intensity of interventions
How the equipment was set up and monitored
These details help readers judge whether your results really came from the intervention and not from outside factors.
Qualitative Research
For qualitative work, context and the researcher’s role are very important. In this case, you should describe:
Where interviews, focus groups, or observations took place
How long each session lasted
How you recorded (audio, video, notes) and transcribed data
Any reflexivity steps, such as keeping a research journal or discussing your role with peers
Example:
“Interviews were conducted in a private meeting room, lasted 45 to 60 minutes, and were audio-recorded with permission. Verbatim transcripts were produced using Otter.ai and manually checked for accuracy.”
<ProTip title="💬 Pro Tip:" description="Use past tense verbs consistently throughout your procedures to match academic standards" />
5. Describe Your Data Collection Methods
Even if you describe procedures, you still need a dedicated explanation of data collection. This clarifies exactly what you collected and how.
Common Data Collection Methods
Introduce the list with a line about method fit, then list common methods:
Surveys and questionnaires - Suitable for large samples and statistical analysis.
Interviews and focus groups - Best for understanding perspectives or experiences.
Observations and field notes - Used in ethnography and grounded theory.
Secondary or archival data - Includes policy documents, financial reports, clinical records, or online datasets. All of which can function as primary sources or secondary data depending on how they’re used within the study.
Experiments - Ideal for testing cause-and-effect relationships.
Example Paragraph
“Data were collected using a self-administered online survey hosted on Qualtrics. Participants had two weeks to complete the questionnaire, with reminder emails sent on Days 5 and 10. The platform automatically exported responses into SPSS for cleaning.”
<ProTip title="🧭 Insight:" description="Always justify why your chosen method fits your research question" />
6. Explain Your Data Analysis Techniques
Readers want to know how your raw data turned into meaningful findings. This section varies depending on whether your study is quantitative or qualitative.
Quantitative Data Analysis
Quantitative analysis requires explanation of preprocessing, statistical tests, and thresholds.
For quantitative studies, you should explain:
Which software you used (SPSS, R, STATA, JASP, etc.)
How you cleaned the data (handling missing values, outliers, errors)
Which statistical tests you applied
The significance level you used (often p < 0.05)
Whether you checked assumptions such as normality or equal variance
Any confidence intervals or effect size measures reported
Common Statistical Tests
Preface with a sentence about matching tests to data and hypotheses, then show a compact table style list:
Test | Purpose |
t-tests | Compare two means |
ANOVA | Compare multiple means |
Regression | Predict relationships |
Chi-square tests | Compare categorical variables |
Correlation | Strength of relationships |
Example paragraph:
“Data were analyzed using SPSS Version 28. Descriptive statistics summarized demographic variables. Independent samples t-tests assessed differences in stress scores between groups. Statistical significance was set at p < 0.05.”
Qualitative Data Analysis
For qualitative analysis, the focus is on themes, patterns, and meanings in the data. In this section, explain:
Which analytic approach you used:
Thematic analysis
Content analysis
Grounded theory
Narrative analysis
Discourse analysis
Whether your coding was:
Inductive (codes developed from the data)
Deductive (codes based on theory or a prior framework)
Any software tools used (NVivo, Atlas.ti, MAXQDA, etc.)
Example:
“Transcripts were coded inductively using NVivo. Thematic analysis followed Braun and Clarke’s six-phase approach, beginning with familiarization and ending with theme refinement.”
Mixed Methods Analysis
If you used mixed methods, explain how you linked the quantitative and qualitative parts.
Common designs:
Sequential: One type of data is collected and analyzed first, then used to shape the next.
Convergent: Both types are collected at the same time, analyzed separately, then compared.
Embedded: One type of data nested inside the other (for example, a few interviews inside a large trial).
Example:
“Quantitative survey findings shaped the interview guide, ensuring that qualitative insights expanded on initial statistical trends. Results were integrated during interpretation to compare convergence and divergence across datasets.”
<ProTip title="🗂️ Reminder:" description="State whether your analysis used deductive or inductive coding to clarify your analytic position" />
7. Address Ethical Considerations
Every methods section should include a short ethics part that shows your study followed the rules and protected people and data.
Key points to cover:
Ethics committee or IRB approval, Name of the board, and the approval number if you have one.
Consent procedures: How participants were informed and how they agreed.
Confidentiality and anonymity: How you removed or protected personal identifiers.
Data protection, Storage, access control, and how long data will be kept.
Safeguards for vulnerable groups. Any extra care taken for minors, patients, or other at-risk groups.
Ethics Example
“The research was approved by the Institutional Review Board (IRB) of the Faculty of Social Sciences (Approval Code: 2024-SSI-117). Participants were informed of their rights, including voluntary participation and withdrawal without consequences.
All data were stored on encrypted drives accessible only to the research team. Identifiers were removed prior to analysis, and pseudonyms were used in all transcripts.”
<ProTip title="🔒 Pro Tip:" description="Always include your protocol or ethics approval number if your institution issues one" />
8. Explain Your Study’s Limitations
A credible methodology acknowledges where your approach may fall short. This strengthens your academic integrity.
Types of Methodological Limitations
A strong methodology also admits its limits. This does not weaken your study; it shows that you understand its boundaries.
Common methodological limits:
Small or local sample
Convenience or non-random sampling
Self-reported data
Short or fixed timeframe
Limited access to some groups or records
Possible researcher bias
Tools that do not capture every detail
Example:
“Because the study used self-report questionnaires, responses may be influenced by social desirability bias. Additionally, the sample was drawn from a single university, which may restrict generalizability to broader student populations.”
9. Organize Your Methodology With Clear Subheadings
Start by reminding readers that structure equals readability; subheadings guide evaluation and replication.
A clear structure helps readers follow your logic. A typical layout is:
Study Design
Participants / Data Sources
Materials and Instruments
Procedures
Data Collection
Data Analysis
Ethical Considerations
Limitations
Before you move on, check:
Could another researcher repeat my study using only this section?
Did I explain why I used each main method, not just what I did?
Did I note any reporting standards, such as CONSORT, PRISMA, STROBE, or COREQ, if they apply?
10. How to Make Your Methodology Clear, Rigorous, and Replicable
This final section focuses on quality. Even well-designed studies can suffer if the methodology is unclear.
Before finalizing your chapter, use this quality checklist.
Clarity Checklist
Ask:
Is every step explained in past tense?
Are all tools and instruments properly named?
Did you write chronologically?
Justification Checklist
Confirm:
Did you explain why each method was chosen?
Did you justify your sampling strategy?
Did you explain your analytic framework?
Replicability Checklist
Verify:
Could another researcher repeat your study based on this section alone?
Are your materials described sufficiently?
Ethics Checklist
Double-check:
Did you document approval?
Did you address confidentiality and data protection?
Transparency Checklist
Ensure:
Did you include reasonable limitations?
Did you mention reporting standards (CONSORT, PRISMA, STROBE, COREQ) if used?
<ProTip title="🧪 Note:" description="If your methods follow a reporting guideline like PRISMA or CONSORT, state this explicitly for extra clarity" />
Writing a Strong Methodology Section of a Research Paper
A solid methodology section of a research paper shows exactly how your study was carried out and why each decision supports your research goals. Clear methods make your work credible, replicable, and easier for reviewers to trust.
<CTA title="Build a Clear Methods Section" description="Turn your design, steps, and process into a structured, publication ready methodology" buttonLabel="Try Jenni Free" link="https://app.jenni.ai/register" />
If you want support turning your design, procedures, and analysis into polished academic writing, Jenni can help you build a cleaner, publication-ready methodology in less time.