By
Nathan Auyeung
—
Null and Alternative Hypothesis Explained Clearly

Nathan Auyeung
Senior Accountant at EY
Graduated with a Bachelor's in Accounting, completed a Postgraduate Diploma of Accounting
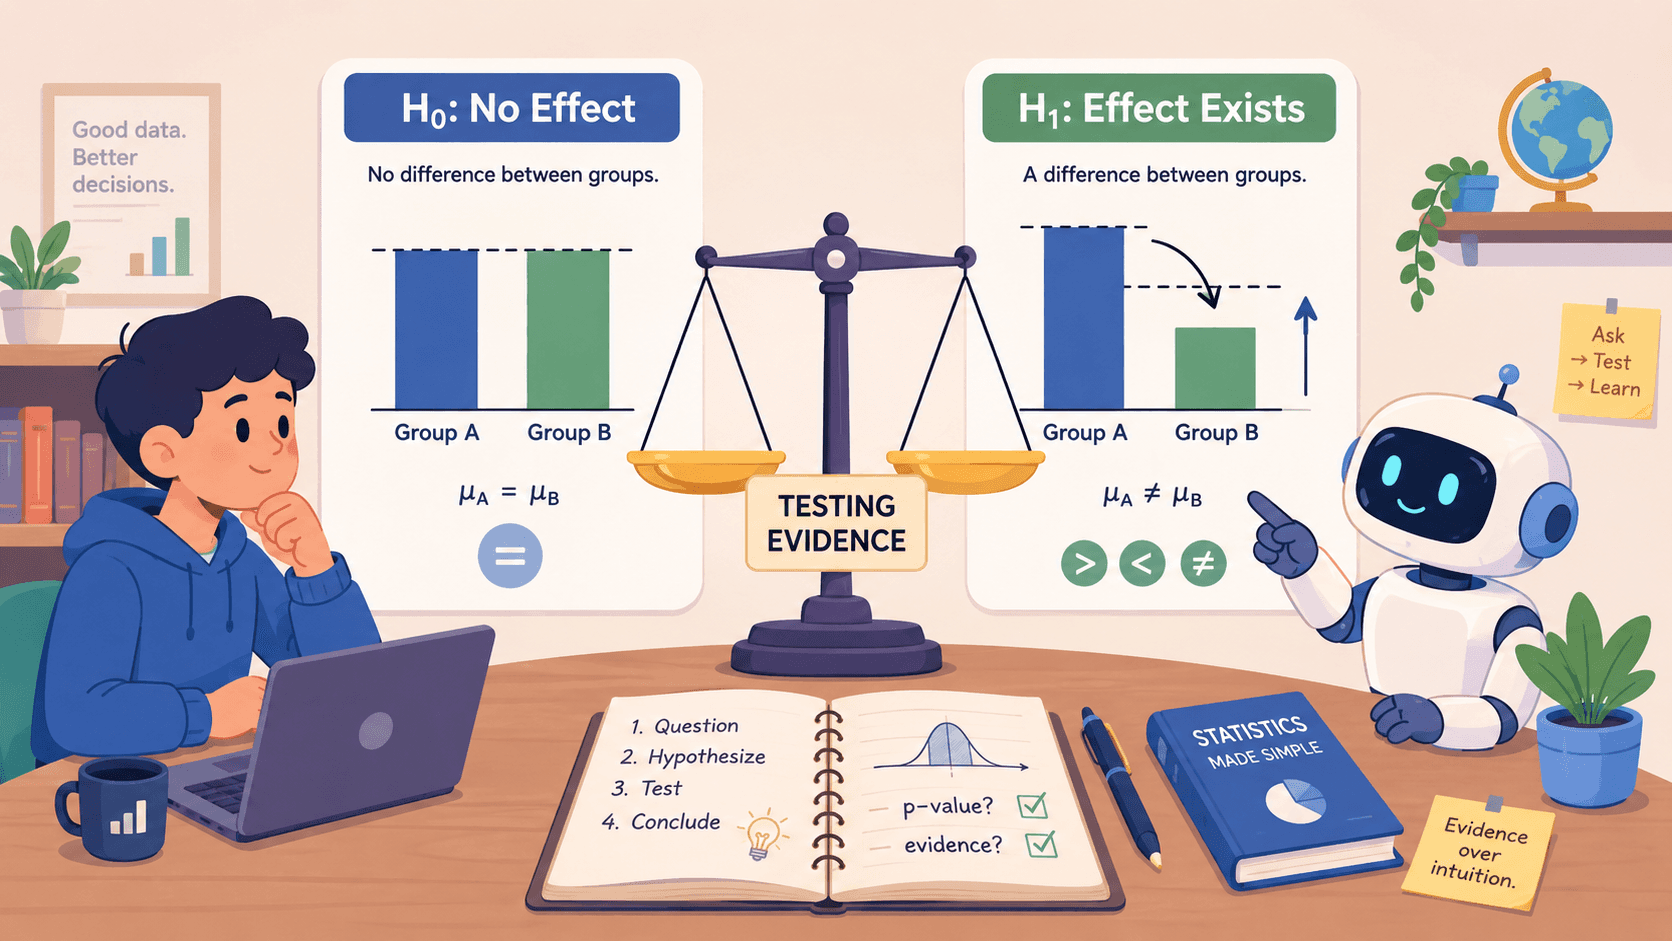
Statistical testing starts with a simple question: is this result real, or just luck? That's what the null and alternative hypothesis are for. They're the formal way researchers in medicine, business, or education set up a test to find out. You'll see them in every study that uses data to make a decision.
We'll break it down with examples, point out where people often trip up, and give you a straightforward guide on how to write your own. You'll finish knowing exactly how these two statements frame every statistical investigation.
<CTA title="Write Clear Research Hypotheses" description="Turn your research questions into precise testable hypotheses with structured guidance." buttonLabel="Try Jenni Free" link="https://app.jenni.ai/register" />
What Are Null and Alternative Hypotheses?
These are two opposite statements about a population you're studying. Think of them as the "innocent until proven guilty" setup for statistics. The whole point of running a test is to see which one the data actually supports.
The National Institute of Standards and Technology (NIST) defines this as the null and alternative hypotheses process, checking if your sample data fits, or fails to fit, your initial assumption about everyone.
The Null Hypothesis (H0)
This is the default, skeptical position. It's the assumption that nothing interesting is happening, no change, no difference, no connection. You try to gather evidence against it.
Examples:
Two teaching methods produce identical average test scores.
A new drug has zero impact on blood pressure.
The amount of time spent studying doesn't affect final grades.
In notation, it usually contains an equals sign:
H0: μ₁ = μ₂ (The means are the same)
H0: ρ = 0 (The correlation is zero)
The Alternative Hypothesis (H1 or Ha)
This is what the researcher actually believes or wants to prove. It states that there is an effect, a difference, or a relationship.
Examples:
Teaching method A leads to higher scores than method B.
The new drug lowers blood pressure.
More study time is linked to better grades.
It's written with an inequality symbol (≠, >, or <):
H1: μ₁ ≠ μ₂ (The means are different)
H1: μ₁ > μ₂ (The first mean is greater)
H1: μ₁ < μ₂ (The first mean is smaller)
<ProTip title="💡 Pro Tip:" description="Always include equality in the null hypothesis to match statistical testing logic." />
Why Null vs Alternative Hypothesis Confuses So Many Students
It's a common hurdle. You can read the definitions, but the logic of why we set it up this way often doesn't click. Here’s where the confusion usually comes from.
The "Why Can't I Just Swap Them?" Problem
A lot of students ask this. If you believe the alternative is true, why not make that the null? The reason is mechanical: the math of a statistical test starts by assuming the null hypothesis is correct.
All the probabilities you calculate, like the famous p-value, are based on that starting point. Swapping them breaks the underlying machinery.
For a deeper look at how this fits into broader scientific frameworks, understanding different research paradigms can help clarify why we use this specific skeptical approach.
A courtroom analogy works well here:
H0: The defendant is innocent.
H1: The defendant is guilty.
The trial doesn't try to prove innocence. It asks if the evidence is strong enough to reject the presumption of innocence.
The Frustration Is Real
On study forums, you'll see the same posts over and over:
"I've read the chapter three times and I'm still lost."
"I get it in class, but I can't apply it."
This usually happens when the concept is taught purely as symbols and rules, detached from any real use.
What Actually Makes It Stick
You need to see it in action. The framework makes immediate sense in concrete scenarios:
Running an A/B test for a website button.
Determining if a new drug works better than a placebo.
Comparing student performance across two curriculums.
Seeing the hypothesis pair written out for a specific, tangible problem, before any formulas, is what builds real understanding.
From Research Question to Hypotheses: A Simple Process
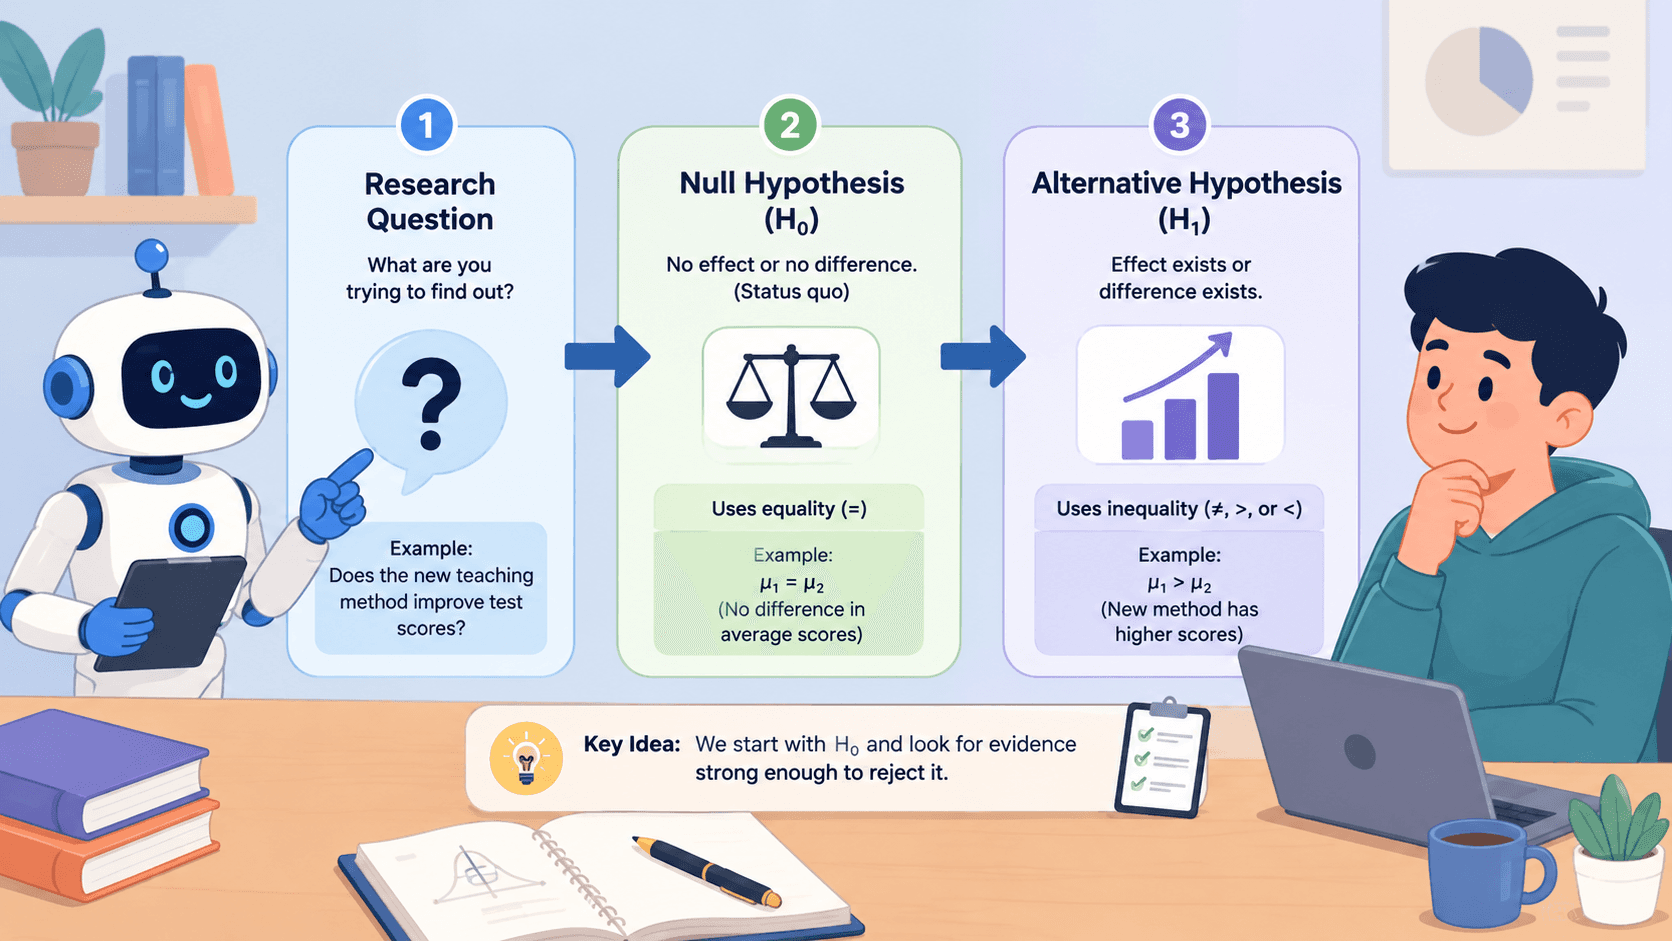
It's a three-step process. The goal is to take a broad research idea and turn it into a specific, testable pair of statements.
Step 1: Ask a Direct Question
Start with something concrete. Avoid vague ideas. Knowing how to write research question effectively is the first step toward a valid hypothesis.
Example: Does a new teaching method lead to higher final exam scores?
Step 2: Identify What You're Measuring
Remember, you're making a claim about the entire population (e.g., all students), not just the sample in your study. Define the key parameter.
This is usually a population mean (μ), a difference between two means (μ₁ - μ₂), or a correlation (ρ).
Step 3: Write the Two Hypotheses
Now, translate your question into the formal H0 and H1. The null always states "no effect." The alternative states the specific effect you're looking for.
H0: μ_new_method = μ_old_method (No difference in average scores)
H1: μ_new_method > μ_old_method (The new method yields higher average scores)
This structured approach is essential when conducting qualitative vs quantitative research, as it ensures your data collection is focused on proving or disproving a specific claim.
A Real-World Example: Sleep and Grades
A psychologist wants to know if sleep deprivation hurts academic performance.
H0: Average test scores are the same for sleep-deprived and well-rested students. (μ_deprived = μ_rested)
H1: Average test scores are lower for sleep-deprived students. (μ_deprived < μ_rested)
This exact structure is the backbone of studies in psychology, drug trials, and market testing.
<ProTip title="💡 Pro Tip:" description="Write hypotheses before collecting data to avoid bias in interpretation." />
One-Tailed vs Two-Tailed Hypotheses
Your alternative hypothesis isn't just about if there's an effect, it's also about what kind of effect you're looking for. This choice is a fundamental part of null and alternative hypotheses design.
The One-Tailed Test (Directional)
This looks for a change in one specific direction. You have a strong reason to believe the effect will only go one way.
Symbol: H1: μ₁ > μ₂ or H1: μ₁ < μ₂
Example: You're testing a fertilizer. Your hypothesis is that it increases plant growth (μ_fertilized > μ_control). You wouldn't test if it decreases growth.
When to use it: When prior research or theory gives a clear prediction about the direction of the effect.
The Two-Tailed Test (Non-Directional)
This looks for any difference, regardless of direction. It's the more conservative, open-minded approach.
Symbol: H1: μ₁ ≠ μ₂
Example: You're comparing two pain relievers. You just want to know if one works differently than the other, better or worse (μ_A ≠ μ_B).
When to use it: When you're exploring a new area or when an effect in either direction would be meaningful.
A Quick Side-by-Side Look
Type | Symbol in H1 | What You're Asking |
One-Tailed | > or < | "Is Group A specifically greater than (or less than) Group B?" |
Two-Tailed | ≠ | "Are Groups A and B different from each other?" |
You have to decide which one fits your research question before you see the data. Picking the wrong one can lead you to miss a real finding or to misinterpret your results entirely.
How Hypothesis Testing Actually Works
The process isn't about proving your idea right. It's about checking if the data makes your initial, skeptical assumption look unlikely.
The Basic Logic
You start by pretending the null hypothesis (H0) is absolutely true. Then you ask: "If H0 is true, how surprising is the data I actually collected?"
The p-value is the answer to that question. It's the probability of seeing your results, or something even more extreme, just by random chance if the null hypothesis is correct.
A small p-value means your data is unusual under the null assumption. A large p-value means your data is pretty much what you'd expect if the null were true.
However, we must be careful with interpretation. Research published in Nature on significance testing highlights that p-values are often misunderstood; they don't tell you the probability that your hypothesis is "true," but rather how compatible your data is with the null.
The Decision Rule
You need a cutoff point to decide what "too surprising" means. This is the significance level, alpha (α), commonly set at 0.05 (5%).
If p-value ≤ α (e.g., ≤ 0.05): The data is considered too unlikely under H0. You reject the null hypothesis.
If p-value > α (e.g., > 0.05): The data isn't surprising enough to ditch H0. You fail to reject the null hypothesis.
What You're Not Saying
This is a crucial distinction. Rejecting H0 doesn't mean you've "proven" the alternative hypothesis (H1) is true. It only means the evidence is strong enough to cast serious doubt on the null.
Think of it like a verdict. A "guilty" verdict doesn't absolutely prove guilt; it means the evidence was sufficient to reject the presumption of innocence. Similarly, you never accept H0 or prove H1. You only find enough evidence to reject H0, or you don't.
<ProTip title="💡 Pro Tip:" description="Say fail to reject the null instead of accept the null in academic writing." />
Common Mistakes in Hypothesis Testing
Hypothesis testing has a few classic pitfalls. Knowing them helps you avoid drawing the wrong conclusion from your data.
Mistake 1: Writing About the Sample
Your hypotheses are claims about the entire group you're studying, the population. Your data is just a sample from it.
Wrong: "The sample mean for Group A is greater than for Group B."
Right: "The population mean (μ) for Group A is greater than for Group B."
Mistake 2: Saying You "Accept" the Null
You never accept the null hypothesis. The test only tells you if you have enough evidence to throw it out. The correct, if clunkier, phrase is "we fail to reject the null."
This wording correctly implies that the data just wasn't strong enough to convince us otherwise; it doesn't prove the null is true.
Mistake 3: Forgetting About the Two Types of Mistakes
Every statistical decision comes with a risk of error. You need to know what they are.
Type I Error (False Positive): Rejecting the null hypothesis when it is actually true. (You see an effect that isn't there.)
Type II Error (False Negative): Failing to reject the null when it is actually false. (You miss a real effect.)
The significance level (α, like 0.05) is directly the probability of making a Type I error.
Mistake 4: Treating p < 0.05 as Magic
A result can be "statistically significant" (p < 0.05) but utterly trivial in the real world. If you have a huge sample, you can detect tiny, meaningless differences.
Conversely, an important finding might not reach p < 0.05 if your sample is too small. The p-value tells you about reliability, not about the size or importance of the effect.
Real-World Examples of Hypothesis Testing
The framework isn't just for textbooks. It's the standard way to make data-driven decisions across many fields.
Business: A/B Testing a Website
An e-commerce team wonders if a redesigned "Buy Now" button will work better.
H0: The click-through rate for the new button is the same as the old one.
H1: The new button has a higher click-through rate. They run the test, split traffic, and collect data. If the results strongly contradict H0 (low p-value), they roll out the new design company-wide. If not, they stick with the original.
Medicine: Clinical Drug Trials
Before a new medication is approved, it must outperform a placebo in a controlled trial.
H0: The drug is no more effective than the sugar pill.
H1: The drug is more effective than the placebo. Rejecting the null here isn't just academic, it's the key step toward regulatory approval and changing how doctors treat a disease.
Education: Evaluating a New Curriculum
A school district pilots a new math program in half its classrooms.
H0: Student proficiency is the same under the new and old programs.
H1: Student proficiency is higher under the new program. The statistical conclusion from this test directly informs a major (and expensive) decision about what to teach next year.
Why Misusing the Null Hypothesis Can Be Dangerous
Misusing this statistical tool doesn't just lead to bad science, it can have real-world consequences, from wasting money to harming public health.
The Problem of P-Hacking
Imagine a researcher measures 20 different outcomes. If they run 20 separate tests with a 0.05 significance level, pure chance alone suggests one of them will show a "significant" result even if nothing is truly happening.
This practice, called p-hacking, creates false discoveries. It's why findings from small, exploratory studies often fail to hold up in larger, more careful trials.
Common Misinterpretations
People often draw the wrong conclusion from the results:
"We failed to reject H0, so there's no effect." This is incorrect. A non-significant result often just means your study wasn't powerful enough to detect the effect. It's evidence of absence, not absence of evidence.
Ignoring the role of sample size. A tiny study might find a huge effect but fail to reach statistical significance. A massive study can find a trivially small effect that is statistically significant. The p-value must be considered alongside the actual size of the effect.
When the Null Hypothesis Is Itself Unrealistic
In many fields, especially social sciences or biology, the idea of absolutely zero effect is a statistical fiction. There's almost always some tiny difference or correlation.
Testing an implausible "no effect" null can lead to a pointless search for statistical significance while ignoring whether the finding is meaningful or useful. The focus can shift from "Is this important?" to simply "Can I get p < 0.05?"
<ProTip title="💡 Pro Tip:" description="Combine statistical significance with practical significance for better decisions." />
A Clearer Path for Hypothesis Testing
Hypothesis testing can feel confusing. This structure helps keep your analysis logical and consistent.
Follow These Steps
Start with a precise research question. What are you actually trying to find out?
Figure out the population parameters you're interested in, like a mean or proportion.
Formulate your null hypothesis (H0). It should always state a condition of equality or "no effect."
Formulate your alternative hypothesis (H1). This states the expected direction of change or difference.
Decide on your test type. Is it one-tailed (looking for a change in one specific direction) or two-tailed (looking for any difference)?
Gather your data and run the calculations to get your test statistic.
Interpret the p-value with care. Understand what it actually tells you about the evidence against H0.
Using this order prevents you from mixing up your hypotheses or misapplying a test. It turns a fuzzy concept into a clear procedure.
Make Hypothesis Testing Finally Click
You keep second-guessing which hypothesis does what. The logic just won't stick when you try to apply it. It gets confusing fast when the terms feel similar and the meaning slips.
<CTA title="Turn Research Questions Into Clear Hypotheses" description="Build strong statistical reasoning with structured writing and guided hypothesis creation." buttonLabel="Try Jenni Free" link="https://app.jenni.ai/register" />
Hypothesis testing isn't about memorizing symbols - it's about understanding a logical framework. Start with a clear research question, write the null as "no effect," and let the data tell you if there's enough evidence to reject it. That shift makes statistical reasoning feel solid, not slippery.