
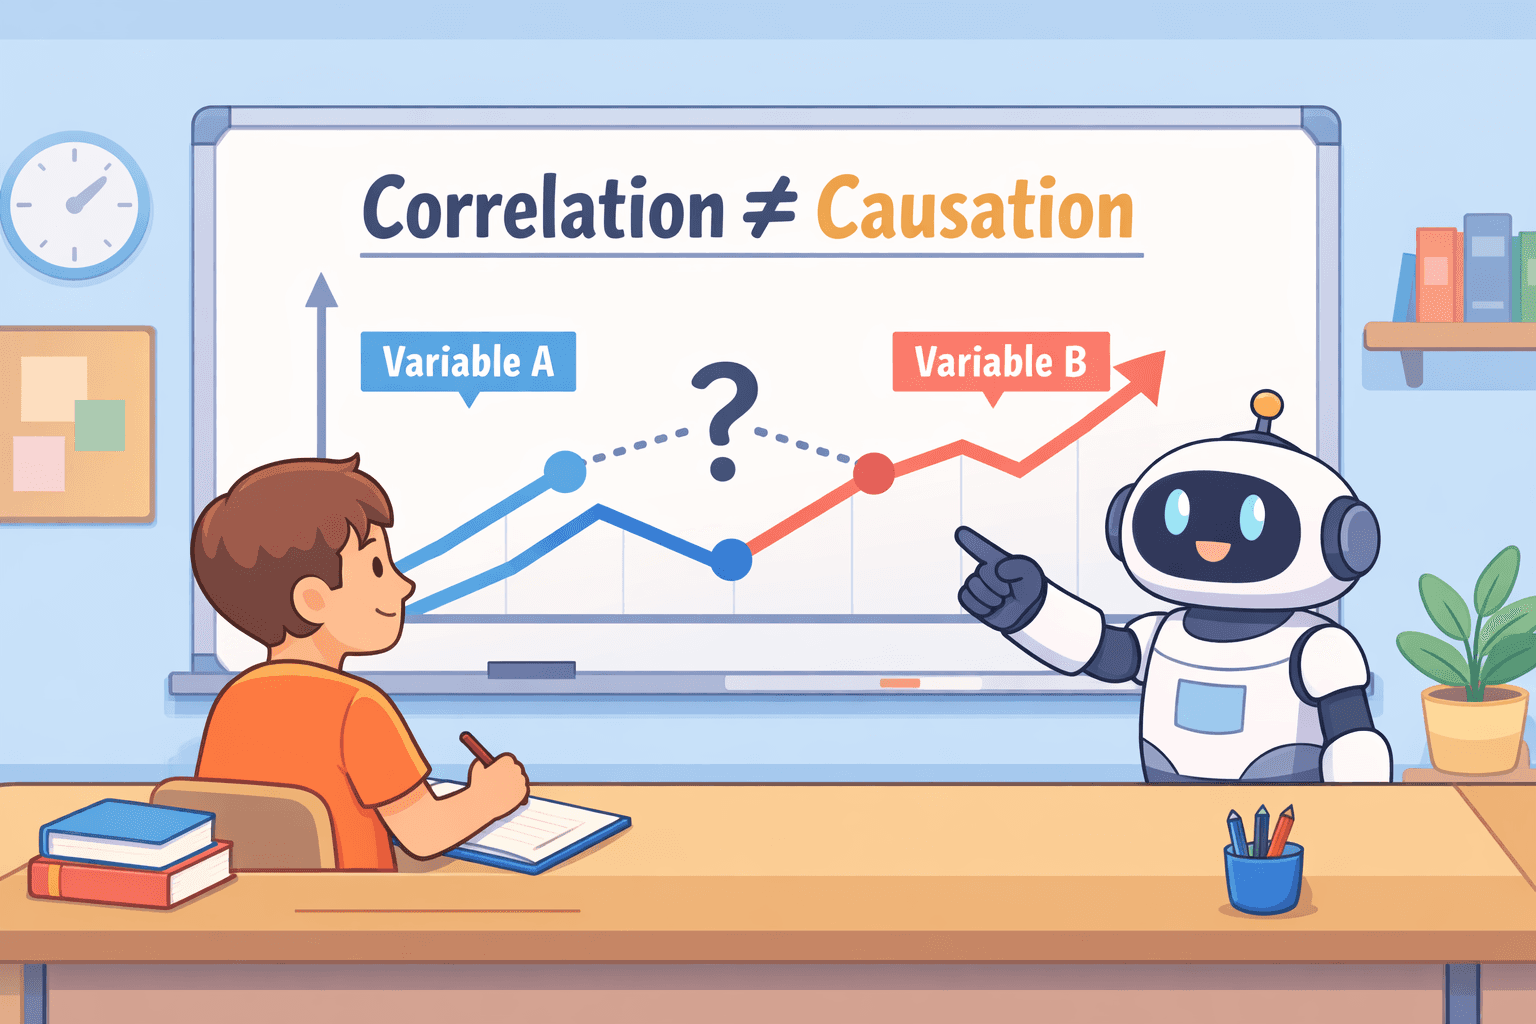
相关性研究在学术界无处不在,但人们往往对其产生误解。仅仅因为两件事物存在关联,并不意味着一方导致了另一方的发生。这是最需要避免的重大误区。
本指南通俗易懂,将带您了解相关性研究的基础知识:这一方法的定义、运作机制、常见的不同类型,以及理解研究结果的正确方法,以确保您不会得出错误的结论。
<CTA title="更快速地理解研究方法" description="将复杂的研究概念转化为清晰、有结构性的笔记和框架,助力撰写更优秀的学术论文。" buttonLabel="免费试用 Jenni" link="https://cn.app.jenni.ai/register" />
什么是相关性研究?
这是一种非实验性研究方法。研究人员用它来研究两个或多个变量之间的关系,但并不改变或控制其中任何一个变量。其核心问题并非探讨因果关系,而是探寻:这些事物是否以某种可预测的方式共同发生变化?如需更深入的解析,请参阅这份关于相关性研究方法论详析的指南。
举一个简单的例子。学习时间越长,通常成绩就越高;屏幕使用时间越长,往往与睡眠质量变差相关联。这些现象展示了一种关系,即相关性。然而,它们并不能证明学习导致了更好的成绩,或者屏幕使用导致了睡眠不足。
研究人员为何使用这种方法
在无法进行受控实验或进行受控实验不符合伦理的情况下,这种方法极具价值。例如,您无法为了研究而随机指派受试者去承受高度精神压力;但您可以测量一组学生的压力水平,并观察这些水平与其学术表现之间的对应关系。此外,该方法对于观察真实世界环境(而非实验室)中变量如何相互作用也非常实用。
<ProTip title="💡 专业建议:" description="相关性展示的是模式,而非因果。务必将变量间的关系与因果解释区分开来。" />
三种相关性类型
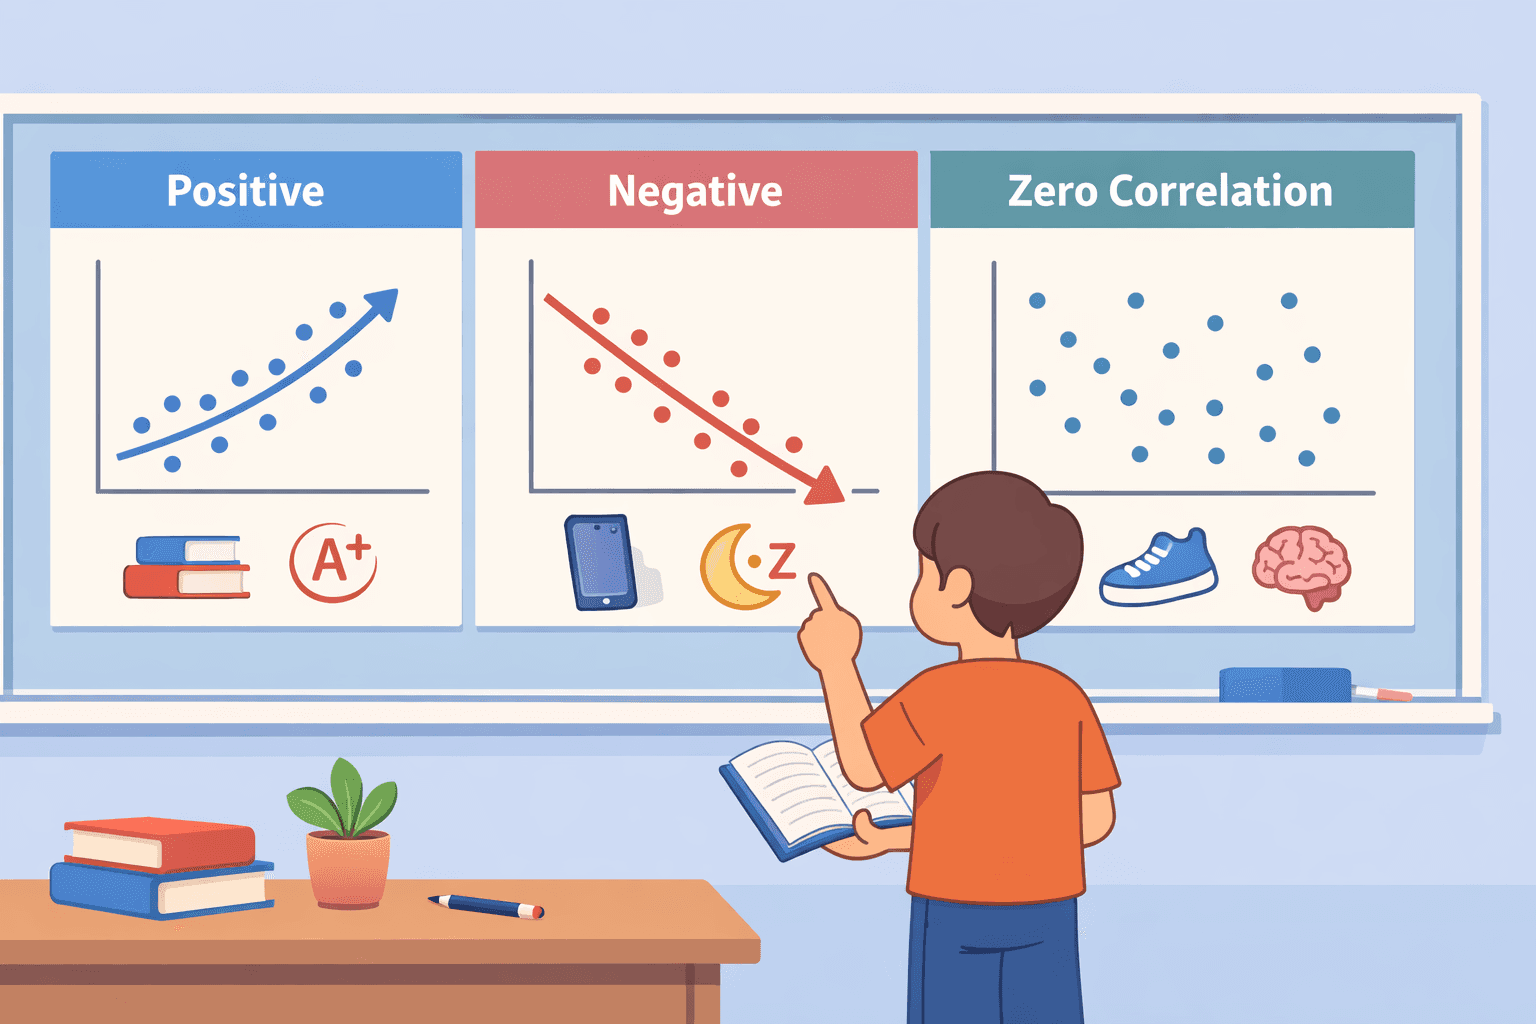
相关性分为三种:正相关、负相关和零相关。明确您所面对的是哪一种,可以避免得出错误的结论。
正相关意味着两个变量同向移动。一个变量的增加通常意味着另一个变量的增加。以学习时间和成绩为例:投入更多的时间往往会带来更好的成绩,图表上的数据点呈现向上倾斜的趋势。
负相关则相反。当一个变量增加时,另一个变量会减少。以睡前屏幕使用时间和睡眠质量为例:屏幕使用时间越长,往往睡眠质量越差、睡眠时间越短、次日疲惫感越强。图表中的趋势线向下倾斜。
最后,零相关意味着两者之间没有真正的联系。一个变量无法提供关于另一个变量的任何信息。例如,您的鞋子尺码与您的智商毫无关系。在散点图上,数据将呈现无规律的随机分布,看不出任何模式。
类型 | 方向 | 现实生活实例 | 图表呈现特征 |
正相关 | 同向变动 | 学习时间与考试成绩 | 上升趋势(数据点自左向右上升) |
负相关 | 反向变动 | 睡前屏幕使用时间与睡眠时长 | 下降趋势(数据点自左向右下降) |
零相关 | 无明显规律 | 鞋子尺码与智商得分 | 无趋势的随机散点分布 |
<ProTip title="🧠 温馨提示:" description="在解释相关性分析结果时,务必同时描述其方向与强度。" />
相关性 vs 因果关系:关键区别
这是本指南中最核心的概念。相关性研究从其设计本质上来说,就无法证明一件事导致了另一件事。它只能表明两件事以某种方式存在关联。如果您需要更清晰的概念梳理,建议复习这篇关于相关性与因果关系区别的详细阐述。
一个常让人陷入误区的经典例子是冰淇淋销量与溺水死亡人数之间有据可查的关系。这两者在夏季月份都会大幅上升,且相关性非常强。但这是否意味着吃冰淇淋会导致人溺水?显然不是。
这背后隐藏着第三个变量:炎热的气候。高温天气既导致了更多的人购买冰淇淋,也导致了更多的人去游泳,从而不幸地导致了更多溺水事件的发生。冰淇淋销量和溺水人数都是同一诱因共同作用的结果。
关联性在实际中可能意味着什么
当您观测到两个变量存在关联时,除了简单的因果链条外,还需要考虑其他解释。真实的关联可能是以下三种情况之一:
第三变量(混杂变量): 一个未被观测到的因素同时影响了您所测量的两个变量,例如冰淇淋例子中的气温。
反向因果: 这种关系完全有可能是反向作用的。是焦虑导致了睡眠变差,还是长期睡眠不足导致了更高的焦虑度?单凭相关性本身是无法解释这一点的。
纯属巧合: 有时,数据模式只是随机偶然出现的,两者之间根本不存在真实的内在联系。
不妨这样想:发现相关性就像每天看到两个人在街上并肩同行。您确实观察到了一种联系,但您完全不知道他们为什么在一起。他们是同事?是朋友?还是其中一人在尾随另一人?相关性向您抛出了一个问题,而不是给出了答案。
<ProTip title="⚠️ 常见错误:" description="当您的研究仅显示相关性时,绝不要说某变量‘导致’了另一变量。请使用‘与……相关’或『与……有关联』等表述。" />
相关性研究 vs 实验性研究
掌握两者的区别对于设计一项出色的研究或评估他人的学术成果至关重要。这两种方法探讨不同性质的问题,并提供不同类型的解答。
理解不同的研究范式同样有助于理解,为什么有些研究侧重于测量变量之间的关系,而另一些研究则旨在检验因果效应。
如果您仍在权衡是进行数值测算还是非数值解读,理解定性研究与定量研究的区别也有助于将相关性研究定位在更合适的宏观方法类别中。
核心区别:观察与干预
相关性研究的核心在于观察。它测量自然状态下发生的变量,以寻找它们之间的规律和联系。在此过程中,研究人员充当的是被动的记录者。
实验性研究的核心则在于主动测试。它涉及故意操纵一个变量(自变量),以观察其是否引起另一个变量(因变量)的改变。研究人员通过主动创造条件来检验特定的假设。
核心差异一览
比较维度 | 相关性研究 | 实验性研究 |
控制程度 | 不对变量进行操纵。 | 对关键变量进行严格控制和操纵。 |
首要目标 | 识别并描述变量之间的关系。 | 检验是否存在因果关系。 |
典型场景 | 真实的、自然发生的场景。 | 受控的实验室或实地实验环境。 |
典型实例 | 测量大学生平均每晚睡眠时间与学期GPA之间的关系。 | 随机安排学生加入“延长睡眠计划”或对照组,随后对比他们的GPA。 |
如何选择合适的方法
在下列特定情况下,您应当倾向于选择相关性研究:
当操纵您感兴趣的变量在实际中不可行或违背学术伦理时(例如研究童年创伤与成年后健康状况的联系)。
当您需要来自不受控的真实世界环境的数据,以观察变量在自然状态下如何关联时。
在研究的初步探索阶段,此时您的目的是寻找规律并提出待后续检验的学术假设。
在下列情况下,实验研究则是必然之选:
您的核心研究问题要求提供因果关系的严谨论证。
您具备控制环境的主观条件,并且能将受试者随机分配到不同的实验条件下。
相关性研究是如何运作的

虽然具体步骤可能有所不同,但每项相关性研究都遵循一个基本的核心概念流程。了解这一过程可以向您揭示研究人员是如何从提出问题一步步走向得出结论的。
研究的几个核心阶段
确定您的变量。 研究人员首先要决定测量哪两个或多个因素。这些因素必须是可量化的。在关于学术表现的研究中,变量可以是“每周学习时间”和“期末考试成绩”。
收集数据。 这涉及从样本中的每一位参与者那里收集每个变量的测量数据。数据可以来源于问卷调查、已有档案记录、直接观测或测试。
测度相关性。 在这一阶段,将对收集到的数据进行统计分析,以计算变量之间关联的强度和方向。
解释分析结果。 研究人员解读统计输出结果,评估其关联强度,并且最关键的是——避免做出因果关系声称。在这一阶段,通常会讨论潜在的第三变量以及研究局限性。
关键指标:相关系数 (r)
这种关系通过名为皮尔逊相关系数(用 r 表示)的统计量来量化。这一数值具有特定的学术含义:
+1.0 代表完全正相关。
0.0 意味着完全不存在线性关系。
-1.0 代表完全负相关。
在学术实践中,您几乎永远不会遇到完美的 1.0 或 -1.0。研究人员通常使用以下准则来判定相关性的强度:
r = 0.70:通常被视为强正相关。
r = -0.40:代表中度负相关。
r = 0.05:属于微弱或极不明显的关联,实质上不具备统计学意义上的关联性。
直观展现模式:散点图
相关系数为您提供了一个具体的数值,而散点图则呈现了一幅直观的图像。在这张图表中,一个变量位于 x 轴,另一个变量位于 y 轴,图上的每一个点代表一位受试者的数据。
数据点紧密聚集并形成一条向右上倾斜的趋势线表示强正相关。
数据点紧密聚集并形成一条向右下倾斜的趋势线表示强负相关。
数据点散乱、呈云状分布且无明显倾斜趋势,表明存在弱相关或零相关。可视化图表往往能使关联的强度一目了然。
<ProTip title="📊 数据处理建议:" description="在信任相关系数之前,务必先观察散点图。极端异常值可能会扭曲统计结果。" />
相关性研究的真实学术案例
通过观察真实的学术研究,可以了解该方法如何在不同领域中被用于揭示事物之间的联系。
教育学:学习习惯与学习成绩 研究人员经常测量学生每周的精神专注学习时间和其 GPA。典型的研究结果是正相关(例如 r = 0.65),表明更多的学习时间与更高的成绩密切相关。这虽然无法证明因果——因为学习动机或先验知识可能同时影响这两者,但它识别出了一种具有现实指导意义的模式。
公共卫生:体育锻炼与压力水平 将体育活动与主观压力水平联系起来的研究一致地显示出负相关。运动较多的人通常自述其承受的压力较小。这种关系可能意味着锻炼减轻了压力、压力较小的人更倾向于多做运动,或者一般健康状况等其他因素同时影响了两者。
商科:客户满意度与客户忠诚度 商业机构经常追踪客户满意度评分和重复购买行为。数据通常显现出稳健的正相关:高满意度与客户忠诚度和二次回购行为高度关联。这并非剖析了促使客户回头的所有深层原因,但它确立了一个对战略制定至关重要的趋势。
这些来自教育、健康和商业领域的学术范例证明,即使相关性研究无法给出确切的因果结论,但它仍是探索趋势和生成研究洞察的不可或缺的基石工具。
相关性研究的学术价值与优势
这种方法被广泛应用,是因为它具有控制实验室实验往往无法提供的实用优势。这些优势中的大部分也在关于相关性研究的优势与局限性的概述中有深入讨论,该概述更广泛地展示了研究人员如何在真实情境中应用该方法。
核心优势
高度的现实普适性。 它在自然发生的状态下检验变量,这使得研究发现对日常生活和实际情境更具参考意义。
伦理可行性。 它允许研究创伤或贫困等敏感课题。在这些课题中,如果通过实验人为操纵变量,在伦理上是绝对不被允许的。
实践中的高效性。 相比于受控的临床或现场实验,这类研究通常耗时更短、成本更低,并且通常可以依赖问卷调查或现有数据库进行二次开发。
启发假设。 它是一种强大的探索性研究工具,能够识别现实世界的关联,并为后续更深入的实验性检验提供明确的研究假设。
为什么学者们信赖此方法 对于很多复杂的科学问题,相关性研究往往是必须要走的第一步。它绘制出了自然状态下已有的规律与关系。这些观测到的关联随后会成为更严密、成本更高的实验性研究的精确靶点,从而有助于建立起牢固的因果关系链条。
绝不容忽视的局限性
相关性研究具有其根深蒂固且不容忽视的局限,这决定了我们在解读其研究成果时必须保持审慎态度。
无法证明因果关系 这是最核心的局限。无论相关性多么强大,它也无法证明一个变量引起了另一个变量的改变。它能确立的仅仅是两者的关联性。
混杂变量的问题 观测到的关联可能是完全由第三个未被测量的因素驱动的,它同时影响了两个变量。这一隐藏的“混杂因素”创造了一种具有误导性的表面关联。
方向性问题 即使存在因果联系,相关性研究的设计也无法确定其因果方向。您无法判定是 A 在影响 B,还是 B 在影响 A。
核心问题实例 以压力与睡眠不足的关系为例。两者的关联很清晰:压力越大往往伴随着越差的睡眠。但数据并不能证实这种关联的本质。是压力降低了睡眠质量,还是低质量睡眠加剧了精神压力?相关性研究对此无法给出定论。
<ProTip title="🔍 学术透视:" description="在您的论文分析中,务必完整列出研究局限性,这能体现出您严谨的批判性思维。" />
相关性研究中的常见硬伤
以下是容易削弱研究公信度或导致得出错误结论的典型谬误。
1. 混淆相关与因果 这是最频繁且严重的学术失误。观察到 A 和 B 互相关联并不等同于证明了 A 导致 B。草率得出该结论会使整篇论文的结果分析完全失效。
2. 忽视第三变量 未能考虑和探讨潜在的混淆因素是重大疏忽。观测到的关系可能是虚假的,完全可以由某个同时影响两者的隐性变量解释。优秀的研究所必需具备的品质是承认并辩证分析这些可能性。
3. 过度解读弱相关 在实际研究中,一个微弱的相关系数(例如 r = 0.15)往往不具有实质性的启发意义。它可能纯属偶然或样本噪声。将极其微弱的相关性视作具有划时代意义的重大发现,是对研究证据強度的扭曲。
4. 变量定义含糊不清 如果研究变量模糊、过于主观或测量方式前后不一致,整项分析都将大打折扣。比如,在没有使用科学信效度量表的情况下粗糙地测量“幸福感”,或者对“学习时间”的界定因参试者主观理解不同而发生偏差,这都会导致产生不可靠的数据和无法被合理释读的结果。
如何科学地解释相关性研究结果
这是许多学术论文在撰写时容易翻车的地方。正确的解释和讨论需要极高、极严谨的态度和清晰的逻辑框架。
重点关注三大核心要素
一份完整严密的学术释读必须涵盖以下几点:
方向。 变量关系是正相关还是负相关?它们是同向运动还是反向互逆?
强度。 这种关联紧密到何种程度?应使用相关系数(r)并结合经典标准(如微弱、中度、显著相关)来客观描述。切忌夸大弱相关发现。
情境。 这一发现在具体的现实研究情境中代表了什么?避免推论过宽、过远。请紧紧围绕数据本身所展示的变量特征展开讨论。
规范学术表述的典范
“统计表明,在此次抽样的大学新生群体中,自述的每周学习时长与学期绩点 (GPA) 之间呈中等程度的正相关关系 (r = 0.58)。这表明,在该受访群体内部,较多的学习时间投入往往与更优异的学术表现相伴随。”
注意这一表述的规范之处:
它使用了精准的学术用语“与……相伴随/相关联”(associated with),而绝非“导致”或“促使”。
它明确指出了方向(正相关)和强度(基于 r = 0.58 的中等关联)。
它将统计数据与实际现实紧密结合,连接了学习行为与学绩产出,且未跨越因果雷区。
它得体地将结论严格限定在特定的样本和语境里(“在此次抽样的大学新生群体中/在该受访群体内部”)。
而错误而鲁莽的解读则会宣称:“这证明了多读书是大学生拿高 GPA 的原因。” 这属于相关性研究设计所支撑不起的因果武断推断。
理解相关性研究的极简思考框架
理解任何相关性研究的基本思考框架:如果您在阅读研究文献或独立设计研究课题时感到思路受阻,请尝试使用以下基本的思维清单。
学习如何构建研究框架也能帮助您更轻松地梳理变量并更清晰地分析、解释它们之间的相互关系。
变量分别是什么? 厘清被测量的两个或多个因素。请尽可能具体。它们是否被清晰界定?是否可进行量化分析?例如,不要只含糊地写出“健康状况”,而应当精确为“每周中等强度运动的分钟数”和“抑郁自评量表得分”。
它们是如何相互关联的? 确定关系的方向。是正相关(两者共同增加)还是负相关(一高一低)?这极大地说明了该理论关联的性质。
这种关系有多强? 关注核心数据:相关系数 (r)。无限逼近 +1 或 -1 的数值暗示着强大的线性连接;接近 0 则意味着微乎其微或无涉。注意,切勿将统计学上的显著性等同于极强的现实相关;在超大样本量下,即便极微弱的相关值也有可能呈现显著。
如何合理解释这一现象? 这是学者最需要彰显学术思辨、也最容易忽视的步骤。尝试去发掘观测关联背后的替代性解释路径。这是否可能是由一个潜在的混杂第三变量带来的?或者因果链条本身就具有双向模糊性?再或是这只是几率偶然?这能强迫您将直观观察与主观臆测完全隔离开,扼杀错误的因果推论。
完美驾驭相关性研究方法论
我们完全理解那份在学术写作中的焦虑——当数据规律看起来极具说服力、却偏偏无法科学地解释背后的因果机制时,这种落差极易引起学术探讨时的底气不足。这是学术界普遍面临的挑战。相关性研究能极好地协助您探索事物间的千丝万缕,然而,一旦您忽略了它的固有局限,您辛苦推演出来的研究结论极易瞬间崩塌。
<CTA title="让复杂的研究概念化繁为简" description="轻松将晦涩繁重的方法论主题转化为条理清晰的结构性学术解读和重点笔记。" buttonLabel="免费试用 Jenni" link="https://cn.app.jenni.ai/register" />
正是基于此,像 Jenni 这样的前沿学术工具能发挥巨大效用,帮助您将零散的思想打磨成极具逻辑深度和高度说服力的学术成果,让您的论述始终保持严谨。这是能显著提升您论文质量与公信力的一步。当您表达严密、逻辑无懈可击时,学术界才会倾听您的声音。