Dwara
Justin Wong
—
Research mein Positive aur Negative Correlation: Meaning aur Examples

Justin Wong
Vikas Prabhari
Graduated kiya Bachelor's me Global Business & Digital Arts, Minor me Entrepreneurship
A correlation dikhata hai ki do cheezein kaise ek saath badalti hain. Agar ve ek saath badhti aur ghat-ti hain, toh yeh ek positive correlation hai. Agar ek upar jaata hai aur doosra neeche aata hai, toh yeh negative hai. Is relationship ko correlation coefficient se maapa jaata hai, jo -1 aur +1 ke beech ki ek sankhya hoti hai.
Is link ki direction aur strength aapke data se sahi nishkarsh nikaalne ke liye bahut zaroori hain. Iska galat matlab nikaalne se aapki findings invalid ho sakti hain. Hum real examples, calculate karne ke liye use hone waale tools, aur researchers dwara ki jaane waali sabse common galatiyon ko dekhenge. Yeh patterns kaise pehchanein aur sahi tareeqe se use karein, yeh seekhne ke liye padhte rahein.
<CTA title="Correlation ko Explain Karna Aasan Banayein" description="Rough research notes ko clear academic writing mein badalne ke liye Jenni ka use karein." buttonLabel="Jenni Free Try Karein" link="https://app.jenni.ai/register" />
Research mein Correlation ko Samajhna
Research mein correlation dikhata hai ki do variables ek saath kaise badalte hain. Yeh kabhi bhi cause aur effect ko prove nahi karta. Yeh simply dikhata hai ki kya do cheezein ek saath move karti hain, alag hoti hain, ya unka aapas mein koi relation hi nahi hai.
Is link ki strength ko correlation coefficient, r, se maapa jaata hai. Yeh sankhya -1 aur +1 ke beech hoti hai. Yeh behtar samajhne ke liye ki correlation coefficient -1 aur +1 ke beech kaise range karta hai, aap is correlation coefficient guide mein detailed explanation dekh sakte hain.
Agar aap yeh dekhna chahte hain ki correlation broader study approaches mein kaise fit hota hai, toh aap research paradigms ko bhi review kar sakte hain, jo explain karta hai ki kaise alag-alag research frameworks data interpretation ko influence karte hain.
+1 ya -1 ke paas ka score ek strong link ko dikhata hai. 0 ke paas ka score matlab bahut kam linear connection hai. Core idea wahi rehta hai: correlation ek pattern ko describe karta hai, kisi cause ko nahi.
Researchers kai practical reasons se correlation ka use karte hain. Yeh costly experiments karne se pehle trends ko detect karne mein madad karta hai.
Yeh tool aapko patterns spot karne, future trends predict karne, aur complex data ko clear insights mein simplify karne mein madad karta hai. Yeh theories create karne aur messy information ko manage karne mein aasan banane ke liye bhi behtareen hai.
<ProTip title="💡 Pro Tip:" description="Correlation values ka matlab nikaalne se pehle hamesha apne data ko plot karein. Ek quick scatterplot aise patterns dikha sakta hai jo ek single number chhipa sakta hai." />
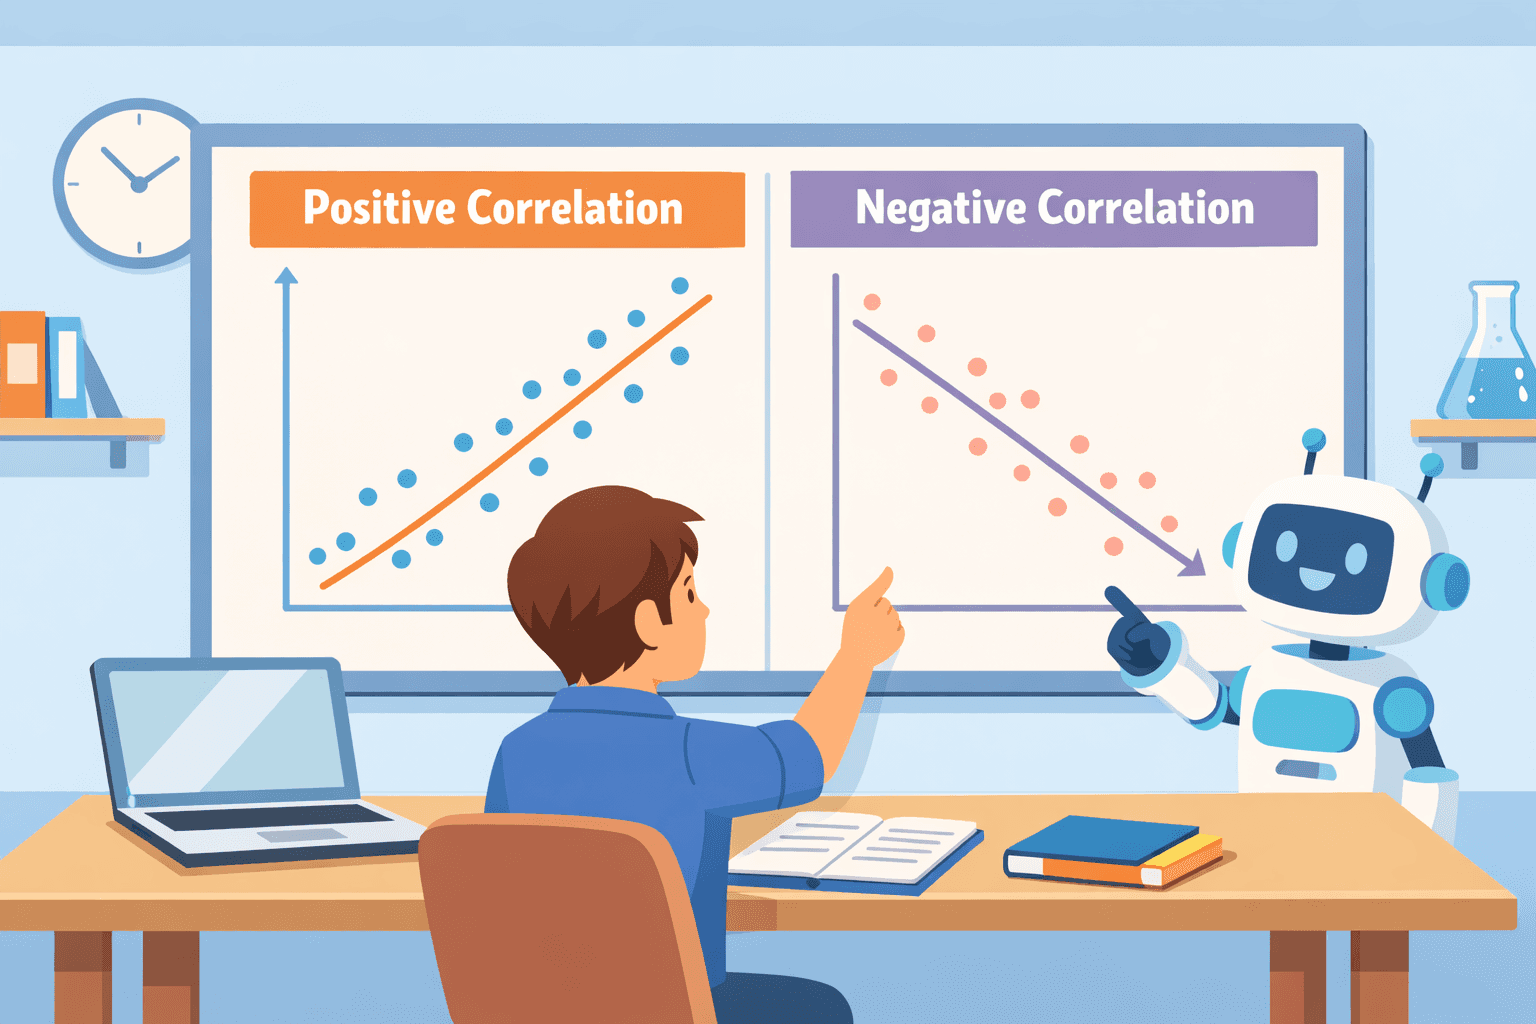
Positive Correlation Explained

Positive correlation ka matlab hai do cheezein ek saath move karti hain. Jab ek upar jaata hai, toh doosra bhi upar jaata hai. Jab ek neeche jaata hai, toh doosra bhi uske peeche jaata hai. Udaharan ke liye, studies dikhati hain ki jo log zyada exercise karte hain, ve aamtaur par mentally behtar feel karte hain.
Ek scatterplot par, yeh relationship ek upward trend banati hai. Data points ek diagonal line ke sath cluster karte hain jo left se right ki taraf badhti hai. Aap ise common pairs jaise study time aur exam scores, ya exercise frequency aur fitness results mein dekh sakte hain.
Income aur education level bhi aamtaur par yahi pattern dikhate hain. Statistically, ek strong link ki r value +0.8 ho sakti hai, jabki ek moderate linkage lagbhag +0.4 ho sakta hai.
Practice mein, ek positive relationship aamtaur par shared growth ya reinforcing factors ki taraf ishara karti hai. Lekin yeh aksar misleading hoti hai. Summer ka example lein: ice cream ki sales aur drowning rates dono badhte hain. Iska asli karan ek hidden variable, garam mausam hai, na ki ice cream aur drownings ke beech ka koi direct link.
<ProTip title="💡 Pro Tip:" description="Positive correlation ka matlab hai ki do variables ek saath move karte hain, lekin yeh prove nahi karta ki ek variable doosre ka karan hai." />
Negative Correlation Explained
Negative correlation ek inverse relationship ko describe karta hai. Jaise-jaise ek variable badhta hai, doosra reliability ke saath ghat-ta hai.
CDC jaise public health organizations ka data aksar yeh pattern dikhata hai. Udaharan ke liye, kuch health risk behaviors life expectancy outcomes ke saath negatively correlate karte hain.
Ek scatterplot par, aapko ek clear downward slope dikhta hai. Graph mein left se right jaane par data points girte hain. Real-world examples aasani se mil jaate hain: zyada stress ka matlab aksar behtar sleep quality ka na hona hota hai.
Tez gaadi chalane se fuel efficiency kam ho jaati hai. Zyada study distractions aamtaur par lower academic performance ki taraf le jaate hain. Statistically, ek strong inverse link ki r value -0.7 ho sakti hai, jabki ek weak link lagbhag -0.2 ho sakta hai.
Yeh inverse relationships practical hain. Yeh trade-offs ko highlight karti hain. Agar ek factor upar jaata hai, toh aap predict kar sakte hain ki doosra lagbhag neeche jayega. Yeh insight healthcare ya economic policy jaise fields mein decisions lene ke liye valuable hai.
<ProTip title="💡 Pro Tip:" description="Negative correlation research data mein trade-offs, risk factors, aur inverse relationships ko spot karne ke liye useful hai." />
Correlation Coefficients ki Strength aur Interpretation
Correlation coefficient aapko do cheezein batata hai: ek relationship ki direction, aur uski strength. +1 ya -1 ke paas ki value ka matlab hai ek strong link. 0 ke paas ki value ka matlab hai ek weak link.
Strength ko interpret karne ka ek common tareeqa yahan hai:
Correlation Type | Value Range | Strength | Example |
Positive | +0.8 | Strong | Study time vs grades |
Negative | -0.6 | Moderate | Stress vs sleep quality |
Zero | 0.0 | None | Hair color vs intelligence |
Ek weak relationship 0.0 aur ±0.3 ke beech hoti hai. Ek moderate relationship ±0.3 se ±0.7 tak hoti hai. ±0.7 se ±1.0 tak kuch bhi strong maana jaata hai.
Agar aapko zero ka correlation milta hai, toh iska matlab hai ki variables ke beech koi straight-line relationship nahi hai. Doosre, aur complex patterns abhi bhi ho sakte hain, lekin linear correlation absent hai.
<ProTip title="💡 Pro Tip:" description="Correlation result ka matlab nikaalne se pehle direction aur strength dono check karein. Sign direction dikhata hai, jabki value dikhati hai ki relationship kitni strong hai." />
Correlation vs Causation: Common Mistakes

Correlation causation ko prove nahi karta. Yeh shayad research ka matlab nikaalne mein sabse frequent hone waali galati hai.
Health organizations ka kehna hai ki yeh confusion logon ko health information galat samajhne par majboor kar sakta hai. Do variables ek saath badh sakte hain bina kisi ek ke doosre ka direct karan bane.
Yeh spurious correlations ke karan hota hai. Ek teesra, hidden factor dono measured variables mein changes lata hai. Aap in misleading relationships ke kai hairatangez examples is spurious correlation examples ke collection mein dekh can hain.
Correlation ko research method ke roop mein kaise use kiya jaata hai, ise behtar samajhne ke liye, aap correlational research ko explore kar sakte hain, jo explain karta hai ki in relationships ko systematically kaise study kiya jaata hai.
Classic examples mein summer ke dauran ice cream sales aur drowning incidents ka badhna shamil hai, jiska asli karan garam mausam hai, na ki ice cream.
Ek aur example bacchon ke shoe size aur reading skills ka hai, ve related lagte hain, lekin aisa isliye hai kyunki bade bacchon ke paas bade pair hote hain aur ve behtar padhte hain.
Yahi baat coffee aur productivity par bhi apply hoti hai. Aisa lag sakta hai ki coffee logon ko zyada productive banati hai, lekin yeh sach mein unka morning routine ya unki acchi neend ho sakti hai.
In relationships ko galat padhne ke real risks hain. Yeh shuruat se hi study ke design ko invalid kar sakta hai. Researchers ek weak link ki importance ko zyada samajh sakte hain.
Ve ek lurking variable ko poori tarah ignore kar sakte hain jo sab kuch explain karta hai. Applied fields mein, iski wajah se faulty assumptions par based galat policy decisions hote hain. Iska result weak predictive models bhi hota hai jo real-world use mein fail ho jaate hain.
<ProTip title="💡 Pro Tip:" description="Nishkarsh nikaalne se pehle confounding variables ko dhundhein. Ek hidden third factor do variables ko sach se zyada connected dikha sakta hai." />
Correlation Analysis ke liye Statistical Methods
Correlation analysis ke liye aap jo method chunte hain, woh poori tarah aapke data par depend karta hai. Sahi method ka use karna aapki findings ko zyada accurate aur interpret karne mein aasan banata.
Correlation tests chalane se pehle, yeh clearly define karna zaroori hai ki aap kya investigate kar rahe hain. Agar aap sure nahi hain ki apni study ko kaise frame karein, toh how to write research question par yeh guide aapko ek strong aur focused research direction build karne mein madad kar sakti hai.
Do sabse common methods Pearson aur Spearman correlation hain.
Pearson correlation do continuous variables ke beech ek straight-line relationship ko maapta hai. Yeh kai experimental studies mein standard choice hai.
Spearman rank correlation ko straight-line relationship ki zaroorat nahi hoti. Yeh sirf check karta hai ki kya values aamtaur par ek saath badhti ya ghat-ti hain unke order ko compare karke, na ki exact numbers ko. Yeh aksar ordinal data ke liye ya jab relationship linear na ho tab use kiya jaata hai.
Agar aap iska deeper understanding chahte hain ki yeh kaise kaam karta hai, toh aap Spearman rank correlation methods ke baare mein aur padh sakte hain.
Method | Best For | Data Type |
Pearson r | Linear relationships | Continuous data |
Spearman rho | Ranked or non-linear trends | Ordinal data |
Toh, aapko kab kisda use karna chahiye? Pearson ko chunein agar aapka data normally distributed hai aur aap ek linear link expect karte hain.
Spearman ko chunein agar aapka data pehle se ranked hai, heavily skewed hai, ya aapko ek non-linear lekin monotonic pattern ka shaq hai. Kabhi-kabhi, dono tests chalana aapke result ki robustness ko check kar sakta hai.
<ProTip title="💡 Pro Tip:" description="Pearson correlation use karne se pehle outliers ko review karein. Kuch unusual values relationship ko usme se sach se zyada strong ya weak dikha sakti hain." />
Correlation ke Real-World Applications
Correlation sirf ek statistical concept nahi hai. Yeh ek practical tool hai jiska use lagbhag har field mein patterns spot karne aur decisions lene ke liye kiya jaata hai.
Psychology aur health research mein, yeh behaviors aur outcomes ke beech connections map karne mein madad karta hai. Studies aksar check karti hain ki kya stress aur anxiety ek saath jaate hain, ya kya behtar neend behtar thinking aur focus se linked hai.
Regular exercise aur improved mood regulation ke beech ka relationship ek aur common focus hai.
Economists aur business analysts trends ko predict karne ke liye ispar rely karte hain. Ve dekhte hain ki kaise income spending ko affect karti hai, ya interest rates investment growth se kaise related hain. Marketing teams analyze karti hain ki advertising spend sales performance ke saath kaise correlate karta hai.
Education researchers iska use evaluate karne ke liye karte hain ki kya kaam karta hai. Ve dekhte hain ki kya jo students class mein zyada aate hain ve school mein behtar karte hain, ya kya zyada padhne se test scores high aate hain.
Yeh yeh assess karne mein bhi madad karta hai ki kya naye teaching methods higher student engagement ke saath correlate karte hain.
Correlation ko Sahi Tareeqe se Interpret Karne ke liye Checklist
Galatiyon se bachne ke liye, correlation ko interpret karte samay ek clear checklist follow karein.
Step-by-step interpretation guide
Direction ko identify karein (positive ya negative)
Strength check karein (weak, moderate, strong)
Scatterplots ka use karke data ko visualize karein
Statistical significance ko test karein
Confounding variables ko dhundhein
Causal assumptions se bachein
Common interpretation errors
Common errors tab hote hain jab context missing ho. Researchers kabhi-kabhi outliers ko ignore karte hain jo results ko skew karte hain. Ve ek small ya specific sample se findings ko overgeneralize karte hain.
Classic error association ko causation ke saath confuse karna hai. Ek aur technical mistake aapke paas jis tarah ka data hai uske liye galat statistical test ka use karna hai.
<ProTip title="💡 Pro Tip:" description="Apna interpretation finalize karne se pehle ek scatterplot ka use karein. Visual patterns aisi problems ko reveal kar sakte hain jo correlation number akele miss kar sakta hai." />
Correlation ko Apne Liye Kaam Karne Dein
Aapne shayad aise data ko dekha hoga jo connected lagta hai lekin fir bhi unclear lagta hai, yeh sochte hue ki kya iska sach mein koi matlab hai. Yeh frustrating hai. Numbers akele khud ko explain nahi karte.
<CTA title="Data Patterns ko Clear Writing mein Badlein" description="Research findings ko zyada structure, clarity, aur confidence ke saath explain karne ke liye Jenni ka use karein." buttonLabel="Jenni Free Try Karein" link="https://app.jenni.ai/register" />
Wahan Jenni jaisa tool aapko zyada confidence ke saath tezi se aage badhne mein madad karta hai, aur patterns ko clear statements mein badalta hai jise aap turant use kar sakte hain. Yeh ek simple step hai jo time bachata hai aur second-guessing se bachata hai.