Dwara
Justin Wong
—
Correlational Research Explained: Types, Examples, aur Key Concepts

Justin Wong
Vikas Prabhari
Graduated kiya Bachelor's me Global Business & Digital Arts, Minor me Entrepreneurship
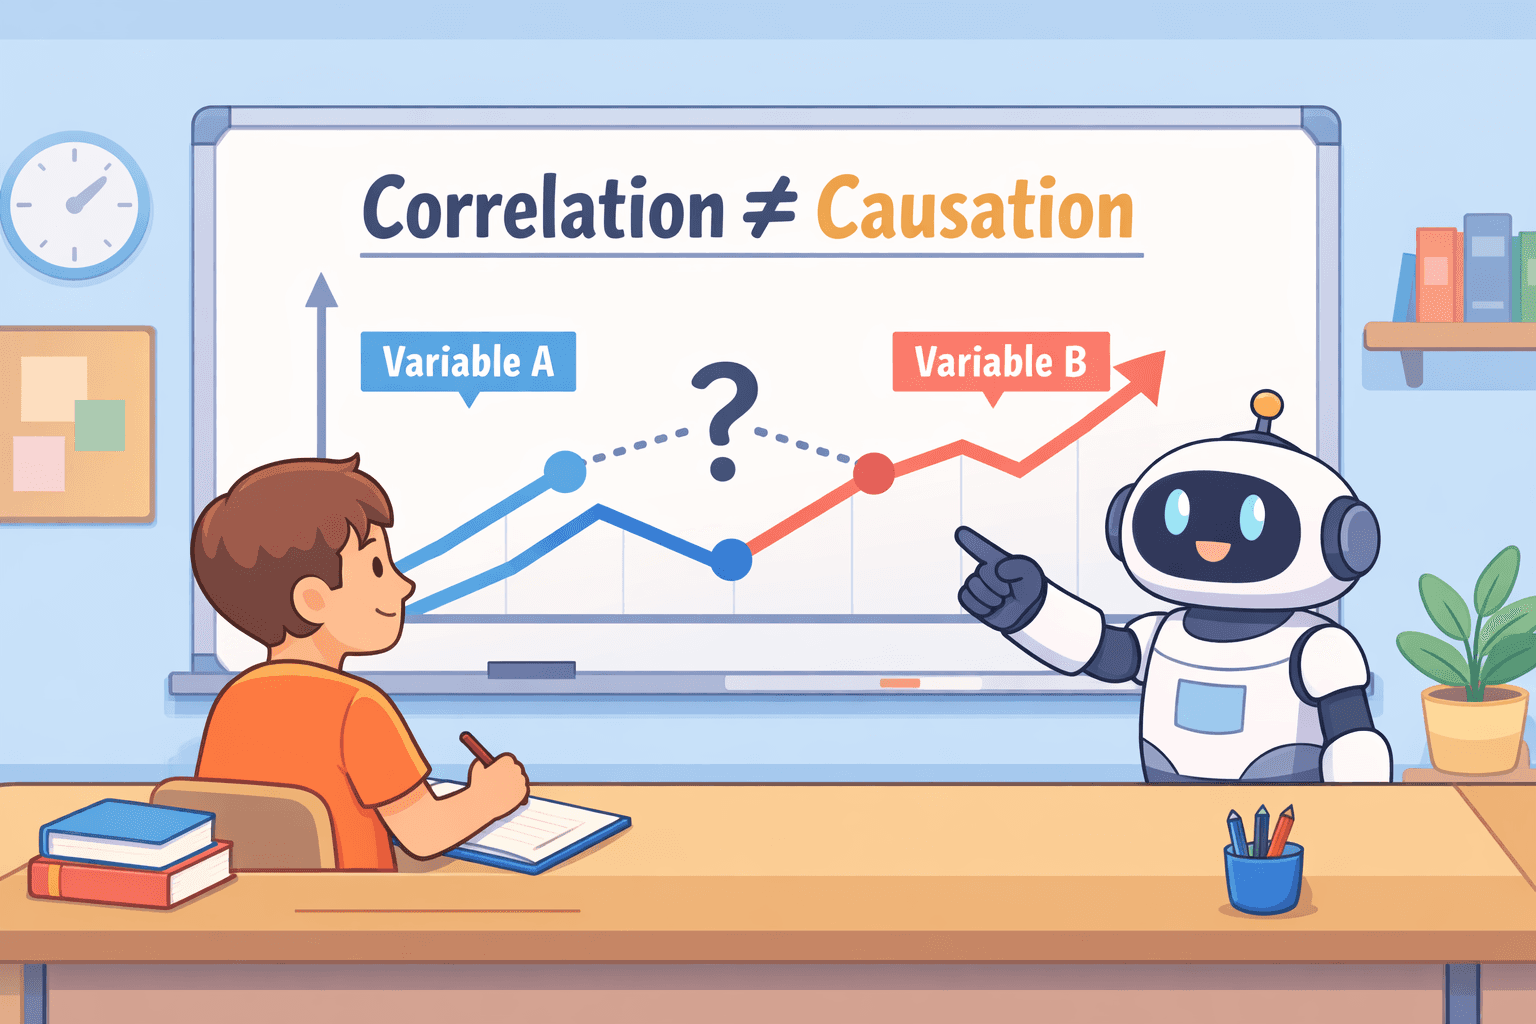
Correlational studies research mein har jagah hain, lekin log aksar inhe galat samajh lete hain. Sirf isliye ki do cheezein aapas mein connected hain, iska matlab yeh nahi ki ek cheez dusri cheez ko ghata rahi hai. Yeh sabse bada trap hai jisse bachna chahiye.
Yeh seedha-saadha guide aapko basics ke through lekar jaata hai: yeh method kya hai, yeh kaise kaam karta hai, aapko dikhne waale alag-alag types kya hain, aur findings ko samajhne ka sahi tareeka kya hai taaki aap kisi galat conclusion par na pahunchein.
<CTA title="Research Methods Ko Tezi Se Samjhein" description="Complex research concepts ko better academic writing ke liye clear structured notes aur frameworks mein badlein." buttonLabel="Jenni Free Try Karein" link="https://app.jenni.ai/register" />
Correlational Research Kya Hai?
Yeh ek non-experimental method hai. Researchers iska use do ya do se zyada variables ke beech ke relationship ko study karne ke liye karte hain, lekin woh inme se kisi ko bhi change ya control nahi karte. Core question cause aur effect ke baare mein nahi hai. Balki, yeh poochta hai: kya yeh cheezein kisi predictable tareeke se ek saath badalti hain? Aur zyada deep breakdown ke liye, correlational research methodology explained par is guide ko dekhein.
Ek seedha-saadha example lein. Zyada study time aksar higher grades ke saath judta hai. Zyada screen time aksar kharab sleep quality se link hota hai. Yeh ek relationship, ek correlation dikhaate hain. Halanki, yeh yeh prove nahi karte ki padhai ne better grade ko cause kiya ya screens ne poor sleep ko cause kiya.
Researchers is method ka use kyun karte hain
Yeh approach un situations mein valuable hai jahan controlled experiment chalana possible ya ethical nahi hota. Aap kisi study ke liye logon ko randomly high stress experience karne ke liye assign nahi kar sakte. Lekin aap students ke ek group mein stress levels ko measure kar sakte hain aur dekh sakte hain ki woh levels unki academic performance ke saath kaise correspond karte hain. Yeh real-world settings mein, lab se bahar, variables kaise interact karte hain, isko observe karne ke liye bhi practical hai.
<ProTip title="💡 Pro Tip:" description="Correlation patterns dikhata hai, causes nahi. Hamesha relationship ko explanation se alag rakhein." />
Correlation Ke Teen Types
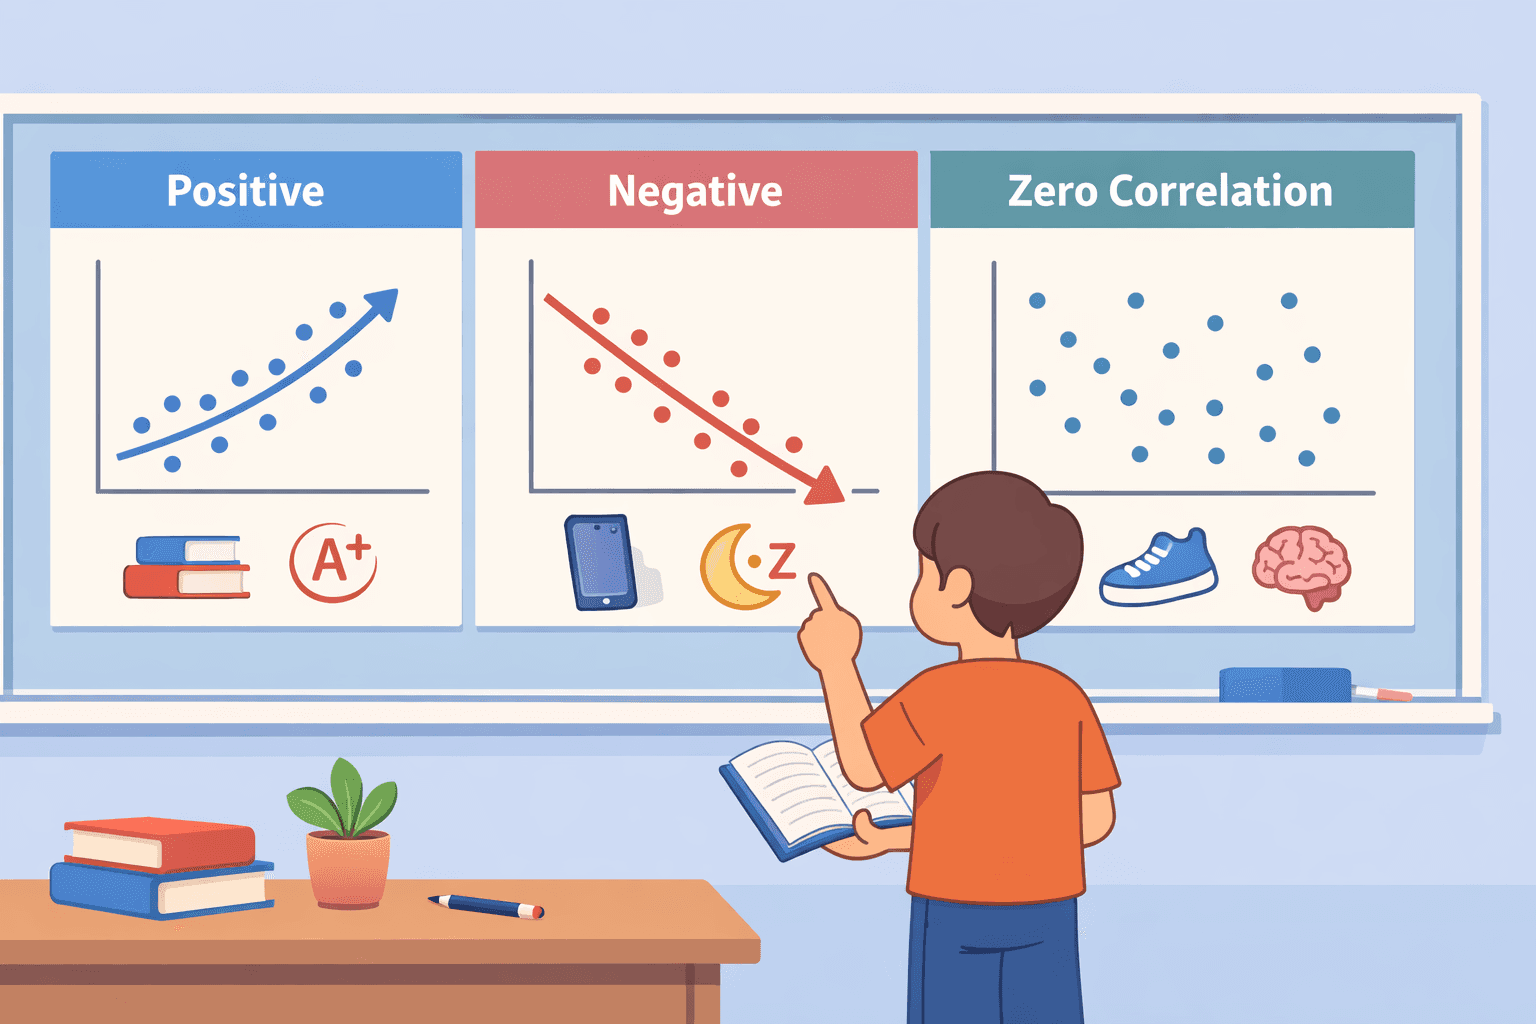
Correlation teen tarah ke hote hain: positive, negative, aur zero. Aap kis type ko dekh rahe hain, yeh jaanna aapko galat conclusions draw karne se bachata hai.
Ek positive correlation ka matlab hai do cheezein ek saath aage badhti hain. Ek ka zyada hona aamtaur par dusre ke bhi zyada hone ko darshata hai. Study time aur grades ke baare mein sochein: zyada ghante lagane se better results milte hain, aur graph par data points upar ki taraf slope banate hain.
Ek negative correlation iska opposite hai. Jab ek cheez upar jaati hai, toh dusri neeche jaati hai. Sone se pehle screen time aur sleep quality ko lein. Zyada screen time kharab neend, kam ghante aur agle din zyada tiredness se linked hai. Graph line neeche ki taraf slope banati hai.
Finally, ek zero correlation ka matlab hai ki koi real link nahi hai. Ek variable aapko dusre ke baare mein kuch nahi batata. For instance, aapke shoe size ka aapki intelligence par koi asar nahi hota. Data plot par ek random scatter hoga, jismein koi pattern dekhne ko nahi milega.
Type | Direction | Real-World Example | Graph Kya Dikhata Hai |
Positive | Same direction | Study hours aur exam scores | Ek upward trend (points left se right rise hote hain) |
Negative | Opposite direction | Sone se pehle screen time aur sleep duration | An downward trend (points left se right fall hote hain) |
Zero | Koi pattern nahi | Shoe size aur IQ score | Bina kisi trend ke ek random scatter |
<ProTip title="🧠 Reminder:" description="Correlation results ko explain karte waqt hamesha direction aur strength dono ko describe karein." />
Correlation vs Causation: Critical Difference
Yeh is poore guide ka sabse important idea hai. Correlational research, apne design ki wajah se, yeh prove nahi kar sakta ki ek cheez dusri cheez ka kaaran banti hai. Yeh sirf yeh dikha sakta hai ki do cheezein kisi na kisi tarah related hain. Agar aapko ek clear conceptual breakdown chahiye, toh correlation vs causation ke differences ka yeh explanation review karne ke laayak hai.
Ek classic example jo logon ko confuse karta hai, woh ice cream sales aur drowning deaths ke beech ka well-documented relationship hai. Dono hi summer months ke dauran tezi se badhte hain. Correlation strong aur real hai. Lekin kya ice cream khaane se log doobte hain? Obviously nahi.
Yahan hidden factor ek teesra variable hai: hot weather. High temperatures ki wajah se log ice cream bhi zyada khareedte hain *aur* swim bhi zyada karte hain, jo unfortunately zyada drowning incidents ki taraf le jaata hai. Ice cream aur drownings dono ek common cause ke effects hain.
Correlation ka actual mein kya matlab ho sakta hai
Jab aap do variables ko linked dekhte hain, toh aapko ek simple cause-and-effect chain ke alawa dusre explanations par bhi consider karne ki zaroorat hoti hai. Real connection inme se koi ek cheez ho sakti hai:
Teesra variable (ek confounder): Ek unseen factor dono cheezon ko influence karta hai jinhe aap measure kar rahe hain, jaise ice cream ke example mein temperature.
Reverse causation: Yeh possible hai ki relationship opposite direction mein kaam kare. Kya anxiety ki wajah se poor sleep hoti hai, ya chronic poor sleep ki wajah se higher anxiety hoti hai? Sirf ek correlation aapko nahi bata sakta.
Pure coincidence: Kabhi-kabhi, patterns bina kisi true underlying link ke randomly chance se bhar aate hain.
Isko is tarah sochein: correlation ko notice karna bilkul aisa hai jaise do logon ko roz sadak par ek saath chalte hue dekhna. Aapne bilkul sahi tarike se ek connection observe kiya hai. Lekin aapko koi idea nahi hai ki woh ek saath *kyun* hain. Kya woh coworkers hain? Friends hain? Kya ek dusre ko follow kar raha hai? Correlation aapko ek question deta hai, answer nahi.
<ProTip title="⚠️ Common Mistake:" description="Jab aapka study sirf correlation dikhata hai, toh kabhi bhi causes na likhein. Associated ya related jaise words ka use karein." />
Correlational vs Experimental Research
Is distinction ko samajhna ek achha study design karne ya kisi aur ke kaam ko evaluate karne ke liye fundamental hai. Dono methods alag sawaal poochte hain aur alag tarah ke answers provide karte hain.
Alag research paradigms ko samajhna bhi yeh explain karne mein madad kar sakta hai ki kuch studies relationships ko measure karne par kyun focus karti hain jabki dusre ka aim causal effects ko test karna hota hai.
Agar aap abhi bhi numerical measurement aur non-numerical interpretation ke beech decide kar rahe hain, toh qualitative vs quantitative research ko samajhna correlational studies ko sahi broader method category mein rakhne mein madad kar sakta hai.
Core difference: observation versus intervention
Correlational research observation ke baare mein hai. Yeh variables ko waise hi measure karta hai jaise woh naturally hote hain, unke beech patterns aur connections ko dhoondhta hai. Researcher ek passive recorder hota hai.
Experimental research active testing ke baare mein hai. Isme deliberate roop se ek variable (independent variable) ko manipulate karna shamil hota hai taaki dekha ja sake ki kya yeh dusre variable (dependent variable) mein change ka kaaran banta hai. Researcher ek specific hypothesis ko test karne ke liye conditions create karta hai.
Key differences ek nazar mein
Aspect | Correlational Research | Experimental Research |
Control | Variables ka koi manipulation nahi. | Key variables ka tight control aur manipulation. |
Primary Goal | Relationships ko identify aur describe karna. | Cause-and-effect ko test karne ke liye. |
Typical Setting | Real-world, natural environments. | Controlled laboratory ya field settings. |
Example | Average nightly sleep aur students ke semester GPA ke beech ke relationship ko measure karna. | Students ko randomly ek sleep extension program ya control group mein assign karna, phir unke GPAs ko compare karna. |
Sahi method chunna
Aapko kuch specific situations mein correlational research par rely karna chahiye:
Jab un variables ko manipulate karna impossible ya unethical ho jismein aap interested hain (jaise childhood trauma aur adult health ke beech ke link ko study karna).
Jab aapko real-world, uncontrolled setting se data ki zaroorat ho taaki dekh sakein ki variables naturally kaise associate hote hain.
Research ke early, exploratory stages mein, jahan aap patterns dhoondh rahe hain aur baad mein test karne ke liye hypotheses generate kar rahe hain.
Ek experiment tab zaroori choice hai jab:
Aapka central question cause aur effect ke proof ki demand karta hai.
Aapke paas environment ko control karne aur participants ko randomly alag-alag conditions mein assign karne ki practical ability ho.
Correlational Research Kaise Kaam Karta Hai

Halanki exact steps vary ho sakte hain, har correlational study ek basic conceptual flow ko follow karti hai. Is process ko samajhna aapko dikhata hai ki researchers ek question se result tak kaise move karte hain.
Study ke core stages
Apne variables ko identify karein. Researcher sabse pehle yeh decide karke start karta hai ki kin do ya do se zyada factors ko measure karna hai. Yeh quantifiable hone chahiye. Academic performance par ek study ke liye, variables 'weekly study hours' aur 'final exam score' ho sakte hain.
Data collect karein. Isme sample ke har participant se har variable ke liye measurements gather karna shamil hai. Data surveys, existing records, direct observations, ya tests se aa sakta.
Relationship ko measure karein. Yahan, collected data par statistical analysis apply kiya jaata hai taaki variables ke beech ke link ki strength aur direction ko calculate kiya ja sake.
Results ko interpret karein. Researcher statistical output ko examine karta hai, iski strength par consider karta hai, aur sabse critically, causation claim karne se bachta hai. Yeh stage woh hai jahan potential third variables aur dusre limitations par discuss kiya jaata hai.
Key metric: correlation coefficient (r)
Relationship ko Pearson correlation coefficient naamak ek statistic ka use karke quantify kiya jaata hai, jise r se symbolize kiya jaata hai. Is number ka ek specific meaning hai:
+1.0 ek perfect positive correlation ko signify karta hai.
0.0 ka matlab hai absolutely koi linear relationship nahi hai.
-1.0 ek perfect negative correlation ko indicate karta hai.
In practice, aapko lagbhag kabhi bhi perfect scores nahi milenge. Researchers strength ko interpret karne ke liye guidelines ka use karte hain:
r = 0.70: Ise aamtaur par ek strong positive relationship maana jaata hai.
r = -0.40: Yeh ek moderate negative relationship ko represent karta hai.
r = 0.05: Yeh ek negligible ya bahut weak correlation hai, essentially koi meaningful relationship nahi hai.
Pattern ko dekhna: scatter plots
Correlation coefficient aapko ek number deta hai, lekin ek scatter plot aapko ek picture deta hai. Yeh ek graph hai jahan ek variable x-axis par hota hai aur dusra y-axis par, jismein har data point ek participant ko represent karta hai.
Points ka ek tight cluster jo ek upward-sloping line banata hai, ek strong positive correlation ko suggest karta hai.
Ek tight cluster jo downward-sloping line banata hai, ek strong negative correlation ko suggest karta hai.
Points ka ek scattered, cloud-like spread bina kisi discernible slope ke ek weak ya zero correlation ko indicate karta hai. Visual aksar relationship ki strength ko immediately clear kar deta hai.
<ProTip title="📊 Data Tip:" description="Correlation values par trust karne se pehle hamesha scatter plots check karein. Outliers results ko distort kar sakte hain." />
Correlational Research Ke Real-World Examples
Actual studies ko dekhne se pata chalta hai ki kaise is method ka use alag-alag fields mein connections ko uncover karne ke liye kiya jaata hai.
Education: study habits aur grades Researchers aksar weekly study hours aur student GPA ko measure karte hain. Ek typical finding ek positive correlation hai (e.g., r = 0.65), jo suggest karta hai ki zyada study time higher grades se associated hai. Yeh causation prove nahi karta, motivation ya prior knowledge dono ko influence kar sakte hain, lekin yeh ek meaningful pattern ko identify karta hai.
Public health: exercise aur stress Physical activity ko perceived stress levels se link karne waali studies consistently ek negative correlation dikhaati hain. Jo log zyada exercise karte hain woh aamtaur par kam stress report karte hain. Relationship ka matlab yeh ho sakta hai ki exercise stress ko kam karti hai, ya yeh ki kam-stressed log exercise zyada karte hain, ya koi aur factor jaise general health dono ko affect karti hai.
Business: satisfaction aur loyalty Companies customer satisfaction scores aur repeat purchase behavior ko track karti hain. Data consistently ek strong positive correlation dikhata hai: higher satisfaction customer loyalty aur repeat business ke saath strongly associated hai. Yeh strategy ke liye ek vital trend ko identify karta hai, halanki yeh customer ke return ke peeche ke har cause ko pinpoint nahi karta.
Education, health, aur business ke yeh examples demonstrate karte hain ki kaise correlational research trends ko spot karne aur insights generate karne ke liye ek fundamental tool hai, bhale hi yeh definitive causal answers na de sake.
Correlational Research Ki Strengths
Yeh method widely use kiya jaata hai kyunki yeh practical advantages provide karta hai jo experiments aksar nahi kar paate. Inme se kai benefits par correlation research strengths and limitations ke is overview mein bhi discuss kiya gaya hai, jo is baat ko expand karta hai ki researchers real contexts mein is method ko kaise apply karte hain.
Key advantages
Real-world applicability. Yeh variables ko waise hi examine karta hai jaise woh naturally occur hote hain, jo findings ko everyday situations ke liye zyada relevant banata hai.
Ethical feasibility. Yeh sensitive topics ki study ki permission deta hai, jaise trauma ya poverty, jahan kisi experiment mein variables ko manipulate karna unethical hoga.
Practical efficiency. Yeh studies controlled experiments ki तुलना mein aamtaur par faster aur less costly hoti hain, jo aksar surveys ya existing data par rely karti hain.
Hypothesis generation. Yeh ek powerful exploratory tool hai jo real-world connections ko identify karta hai aur future experimental testing ke liye specific hypotheses generate karta hai.
Researchers is par rely kyun karte hain Complex questions ke liye, correlational research aksar zaroori starting point hota hai. Yeh natural settings mein existing patterns aur relationships ko map karta hai. Yeh observed links phir establish causation ke liye design kiye gaye aur zyada rigorous, aur expensive, experimental studies ke liye defined targets ban jaate hain.
Limitations Jinhe Aapko Ignore Nahi Karna Chahiye
Correlational research ke inherent aur significant constraints hote hain jo shape karte hain ki iske findings ko kaise interpret kiya jana chahiye.
No proof of causation Yeh fundamental limitation hai. Ek correlation, chahe woh kitna bhi strong kyun na ho, yeh demonstrate nahi kar sakta ki ek variable dusre mein change ka kaaran bana. Yeh sirf yeh establish karta hai ki ek relationship exist karta hai.
The problem of confounding variables Ek observed link puri tarah se ek teesre, unmeasured factor se driven ho sakta hai jo dono variables ko influence karta hai. Yeh unseen "confounder" ek misleading association create karta hai.
The directionality problem Bhale hi ek causal link exist karta ho, design iski direction ko determine nahi kar sakta. Aap nahi bata sakte ki kaun sa variable dusre ko influence kar raha hai.
Core problem ka example Stress aur poor sleep ke beech ke relationship ko lein. Correlation clear hai: higher stress worse sleep ke saath associate karta hai. Lekin data link ke nature ko confirm nahi kar sakta. Kya stress sleep quality ko kam karta hai, ya poor sleep stress ko badhati hai? Ek correlational study isko suljha nahi sakti.
<ProTip title="🔍 Research Insight:" description="Strong critical thinking dikhane ke liye hamesha apne analysis mein limitations ko shamil karein." />
Correlational Research Mein Common Mistakes
Yeh typical errors hain jo study ki credibility ko undermine kar sakte hain ya incorrect conclusions ki taraf le ja sakte hain.
1. Correlation se causation assume karna Yeh sabse frequent aur serious error hai. Yeh observe karna ki A aur B related hain, is baat ka evidence nahi hai ki A ki wajah se B hota hai. Us conclusion par jump karna findings ke interpretation ko invalidate kar deta hai.
2. Third variables ko ignore karna Possible confounding factors par consider aur discuss na karna ek bada oversight hai. Ek observed relationship spurious ho sakti hai, jo poori tarah se ek hidden variable se explain hoti hai jo aapke measure kiye gaye dono variables ko affect karti hai. Acha research in alternative explanations ko acknowledge aur debate karta hai.
3. Weak correlations ko overinterpret karna Ek chhota correlation coefficient, jaise r = 0.15, practical terms mein aksar statistically meaningless hota hai. Yeh ek trivial finding ya random chance ka product ho sakta hai. Ek weak correlation ko ek important discovery ke roop mein treat karna evidence ki strength ko galat dikhata hai.
4. Poorly defined variables ka use karna Agar variables vague, subjective, ya inconsistently measure kiye gaye hain, toh poora analysis compromise ho jata hai. For instance, bina kisi clear, validated scale ke "happiness" ko measure karna, ya "study time" ko is tarah define karna ki participants ise alag tarike se interpret karein, unreliable data aur weak, uninterpretable results produce karta hai.
Correlational Findings Ko Kaise Interpret Karein
Yeh woh stage hai jahan kai analyses galat ho jaate hain. Proper interpretation ke liye discipline aur ek clear framework ki zaroorat hoti hai.
Teen core elements par focus karein
Ek complete interpretation ko in points ko address karna chahiye:
Direction. Kya relationship positive hai ya negative? Kya variables ek saath move karte hain ya opposite directions mein?
Strength. Association kitna strong hai? Ise describe karne ke liye correlation coefficient (r) aur standard guidelines (e.g., weak, moderate, strong) ka use karein. Kisi weak finding ko badha-chadhakar na batayein.
Context. Study ke real-world setting ke andar is relationship ka kya matlab hai? Speculative leaps se bachein. Jo data actually dikhata hai ki yeh variables kaise relate karte hain, us par tike rahein.
Sahi interpretation ka example
"Analysis ne university students ke sample ke beech self-reported weekly study hours aur semester GPA ke beech ek moderate positive correlation (r = 0.58) ko reveal kiya. Yeh suggest karta hai ki, is group ke andar, study time ka zyada amount higher academic performance se associated hai."
Dhayan dein yeh statement kya karta hai:
Yeh precise term "associated with" ka use karta hai, kabhi "caused" ya "led to" ka nahi.
Yeh explicitly direction (positive) aur strength (moderate, based on r = 0.58) ko state karta hai.
Yeh statistics ko ek real-world meaning se connect karta hai, study behavior ko bina overstep kiye ek performance outcome se link karta hai.
Yeh properly conclusion ko limit karta hai specific sample aur context tak ("is group ke beech").
Ek flawed interpretation claim karega, "Yeh prove karta hai ki zyada padhne se students ko better grades milte hain." Yeh ek causal claim hai jise design support nahi kar sakta.
Correlational Research Ko Samajhne Ka Ek Simple Framework
Kisi bhi correlational study ko samajhne ke liye ek simple framework: agar aap kisi study ko review kar rahe hain ya apna design kar rahe hain aur stuck feel kar rahe hain, toh is basic mental checklist ke through kaam karein.
Building how to create a research framework prerna de sakta hai taaki aapke variables ko organize karna aur unke relationships ko aur zyada clearly interpret karna easy ho sake.
Variables kya hain? Measure kiye ja rahe do ya do se zyada factors ko identify karein. Specific rahein. Kya woh clearly defined aur quantifiable hain? For example, sirf "health" note na karein; "weekly minutes of moderate exercise" aur "score on a depression inventory" specify karein.
Woh kaise related hain? Relationship ki direction determine karein. Kya yeh positive hai (dono ek saath increase hote hain) ya negative (ek badhta hai jab dusra neeche jata hai)? Yeh aapko link ka nature batata hai.
Relationship kitna strong hai? Correlation coefficient (r) ko dekhein. +1 ya -1 ke paas ka number ek strong linear relationship ko indicate karta hai. 0 ke paas ka number ek weak ya nonexistent relationship ko suggest karta hai. Ek statistically significant result ko ek strong result samajhne ki bhool na karein; ek bada sample hone par ek tiny correlation bhi significant ho sakta hai.
Ise kya explain kar sakta hai? Yeh critical, aksar missed, step hai. Observed link ke liye alternative explanations generate karein. Kya koi teesra variable responsible ho sakta hai? Kya direction of influence unclear hai? Kya yeh coincidence ho sakta hai? Yeh step aapko observation ko assumption se alag karne ke liye force karta hai aur aapko galat tarike se causation infer karne se rokta hai.
Correlational Research Ko Sahi Tareeke Se Wrap Up Karna
Aap confusion feel kar sakte hain jab patterns convincing lagte hain lekin actually yeh explain nahi karte ki cheezein kyun hoti hain, aur woh gap likhte ya analyze karte waqt aapke confidence ke saath mess kar sakta hai. Yeh frustrating hai. Correlation aapko connections dekhne mein madad karta hai, lekin agar aap iski limits ko bhool jaate hain, toh aapke conclusions tezi se bikhar sakte hain.
<CTA title="Complex Research Concepts Ko Simplify Karein" description="Mushkil research topics ko ease ke saath clear structured explanations aur study notes mein badlein." buttonLabel="Jenni Free Try Karein" link="https://app.jenni.ai/register" />
Wahan par Jenni jaise tools aate hain, jo aapko rough thoughts ko clear points mein badalne mein madad karte hain taaki aapke ideas sharp aur follow karne mein easy rahein. Yeh ek simple step hai jo aapke kaam ko strong aur believable banata hai. Jab aapka explanation clear hota hai, toh log aapki baat par trust karte hain.