Dwara
Justin Wong
—
ANOVA aur Post Hoc Tests: Ek Saaf Step-by-Step Guide

Justin Wong
Vikas Prabhari
Graduated kiya Bachelor's me Global Business & Digital Arts, Minor me Entrepreneurship
ANOVA aur post hoc tests teen ya usse zyada group means ko compare karne ke liye zaroori hain. Iski jagah repeated t-tests use karne se aapka false positive rate badh jayega aur aapki findings compromise ho jayengi.
Yeh guide variance ke basics se lekar sahi post hoc test select karne tak ka complete workflow provide karti hai. Aap confidence ke saath apne ANOVA results ko run, interpret, aur report karna seekhenge.
<CTA title="Analyze Data with Clarity" description="Structure your statistical workflow and interpret results faster with guided prompts." buttonLabel="Try Jenni Free" link="https://app.jenni.ai/register" />
ANOVA Actually Kya Test Karta Hai
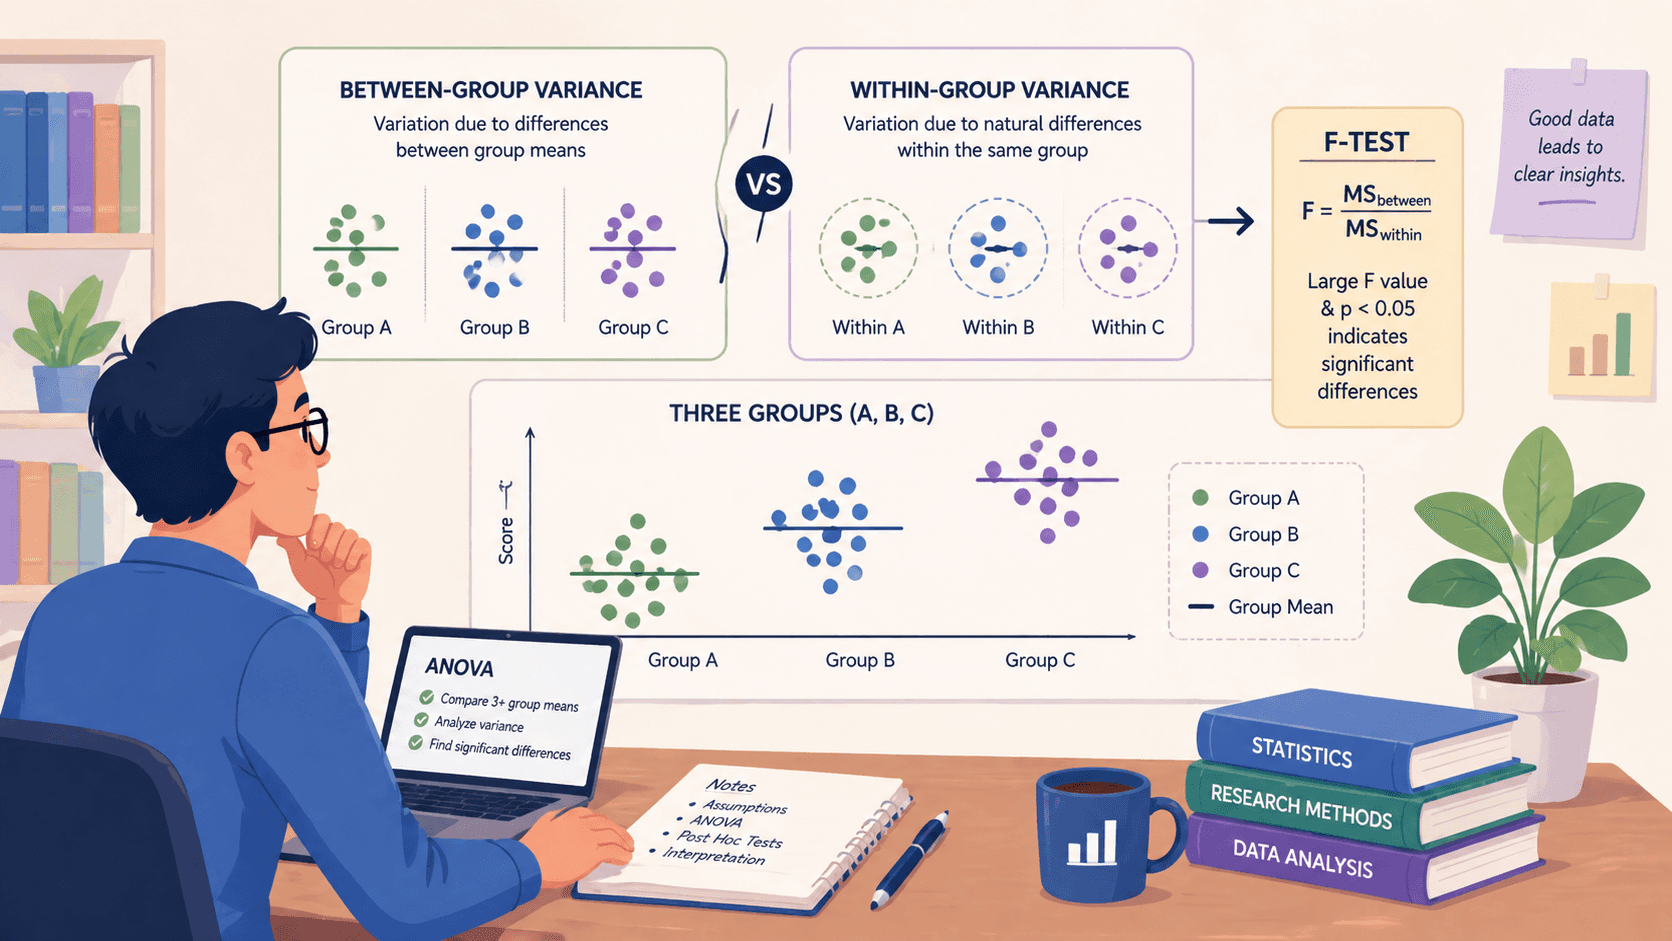
ANOVA, yaani analysis of variance, yeh check karta hai ki teen ya usse zyada groups ke average scores sach mein alag hain ya nahi. Yeh do tarah ke variation ko compare karke aisa karta hai.
In statistical structures ki foundational samajh pane ke liye, aapko the ultimate guide to anova helpful lag sakta hai jisse aap dekh sakein ki data groups kaise interact karte hain.
Aapke data ka total variation do hisson mein split ho jata hai:
Between-group variance: Jo differences aap dekhte hain jo shayad aapke treatments ya conditions ki wajah se ho sakte hain.
Within-group variance: Ek hi group ke logon ke beech ke natural, random differences, jo essentially background noise hain.
Core calculation F-statistic hai. Yeh sirf between-group variance ko within-group variance se divide karke nikalta hai. Ek bada F-statistic, jisme p-value typically 0.05 se kam hoti hai, aapko batata hai ki group differences usse bade hain jitna aap sirf chance se expect karte.
Logic Ko Samajhna
Ek simple analogy hai alag-alag classrooms ke test scores ko compare karna. Agar har class ka average score similar hai, toh classes ke beech ka variation chhota hai. Lekin agar ek class consistently bahut zyada score karti hai, toh woh between-class variation bahut badh jata hai.
ANOVA us effect ko quantify karta hai. Yeh objective approach qualitative vs quantitative research ki ek pehchan hai, jahan hypothesis ko prove ya disprove karne ke liye numerical data ka use kiya jata hai.
ANOVA Table Ke Key Components
Aapko standard ANOVA output mein yeh elements milenge:
Sum of Squares (SS): Total squared variation.
Degrees of Freedom (df): Independent pieces of information ka number.
Mean Squares (MS): Average variation (SS/df).
F statistic: Significance test ke liye use hone wala final ratio (MS between / MS within).
Har part aapko yeh samajhne mein help karta hai ki jo differences aap dekh rahe hain woh meaningful hain ya sirf random noise.
<ProTip title="💡 Pro Tip:" description="Always report effect size like eta squared alongside p values for stronger interpretation." />
Step 1: Pehle ANOVA Assumptions Check Karein
Pehle uske core assumptions check kiye bina ANOVA run na karein. Is step ko skip karne se aapko easily misleading results mil sakte hain.
Teen Core Assumptions
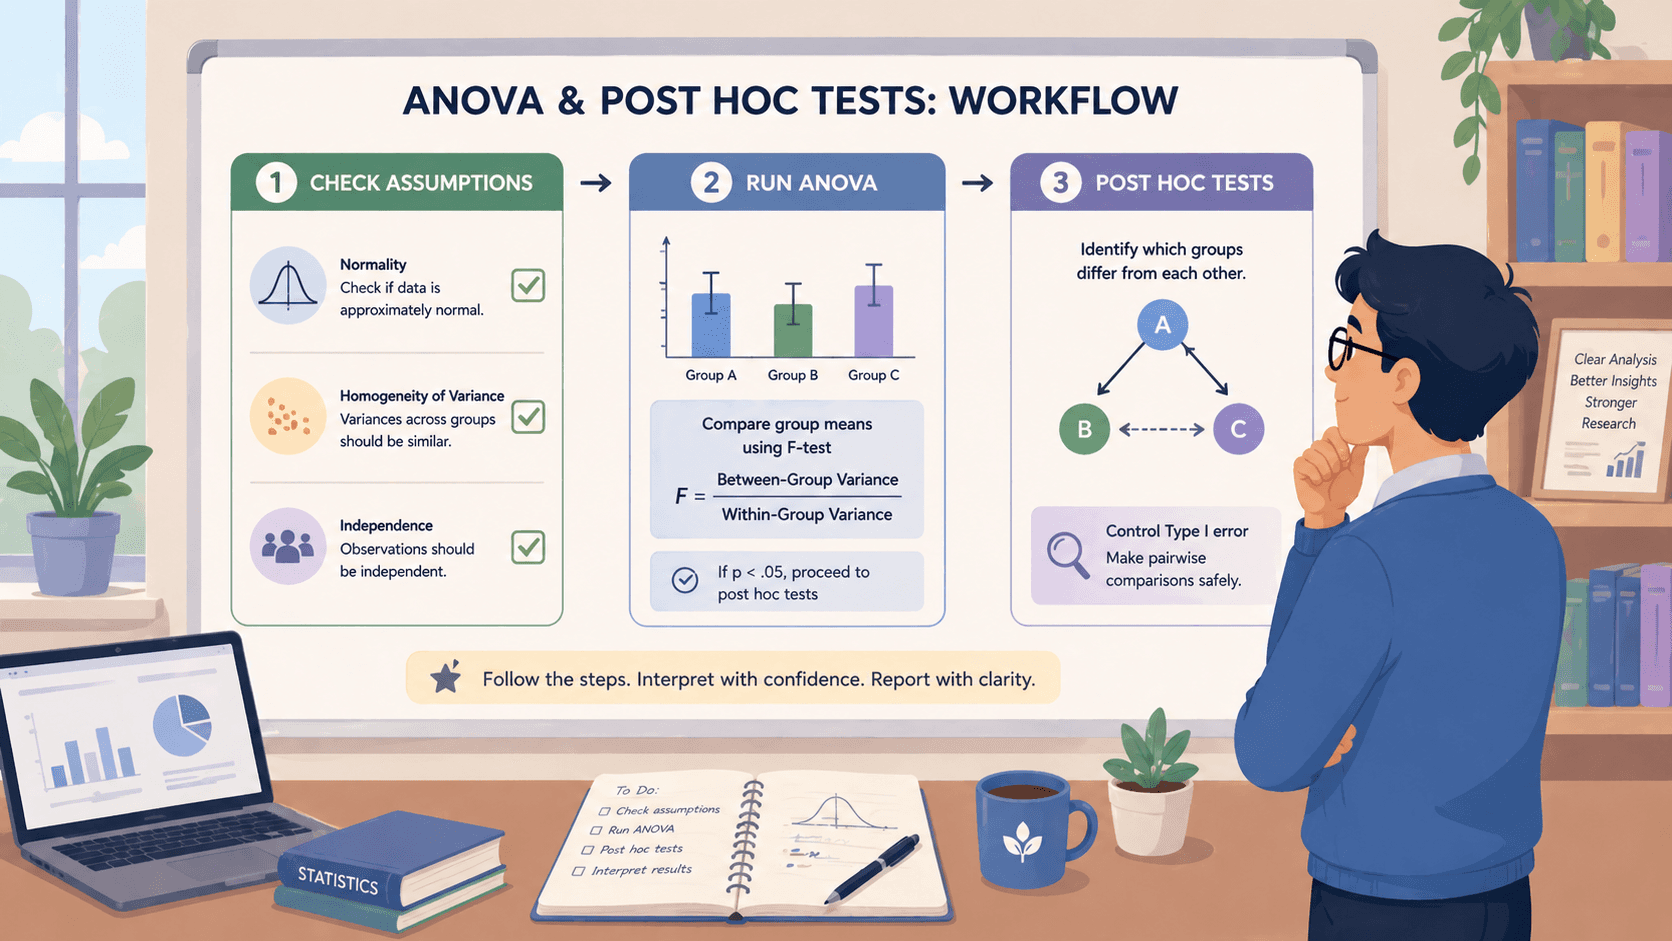
ANOVA teen conditions ke reasonably meet hone par depend karta hai:
Normality: Aapka data roughly ek normal distribution ko follow karna chahiye.
Homogeneity of variance: Scores ka spread (variance) sabhi groups mein similar hona chahiye.
Independence: Har ek observation ka dusre observations se koi relation nahi hona chahiye.
Yeh sirf formalities nahi hain, yeh aapko biased ya galat conclusions nikalne se rokti hain.
Inhe Practice Mein Kaise Test Karein
Normality ke liye, residuals ka Q-Q plot dekhein ya Shapiro-Wilk test run karein.
Homogeneity of variance ke liye, Levene’s test sabse common check hai.
Independence ko statistically test nahi kiya jata; yeh aapke study design ka ek feature hai. Make sure karein ki aapka data aise collect nahi kiya gaya tha jo ek observation ko dusre se link kare.
Isi wajah se how to write a research question ko effectively seekhna zaroori hai, yeh ensure karta hai ki aapka experimental setup shuru se hi logically sound ho.
Agar Assumptions Fail Ho Jayein Toh?
Agar aapka data in rules ko break karta hai, toh aapko ek alag test ki zaroorat hogi.
Agar variances unequal hain, toh aapko welch and brown forsythe one way anova check karna chahiye.
Agar data normal nahi hai, toh Kruskal-Wallis test ek accha non-parametric alternative hai.
Repeated measures ke liye jahan independence fail hoti hai, Friedman test par consider karein.
In checks ko ignore karna ek common mistake hai. For instance, National Institutes of Health ka ek review note karta hai ki biomedical research mein ANOVA assumptions ko violate karne se reported significance levels seriously distort ho sakte hain.
<ProTip title="📊 Reminder:" description="Small sample sizes often cause post hoc tests to lose power even after significant ANOVA." />
Step 2: ANOVA Test Run Karein
ANOVA test run karne ka matlab hai aapne total data variance ko parts mein break down kiya aur unhe F-statistic ke saath compare kiya.
Yeh process deeply specific research paradigms mein rooted hai jo empirical evidence aur objective measurement ko prioritize karte hain.
One-Way ANOVA Example
Maan lijiye aap teen alag-alag teaching methods ke student test scores ko compare kar rahe hain. Analysis run karne ke baad, aapka software aisa result deta hai: F(3, 56) = 17.66, p < .001
Yeh aapko batata hai ki teaching method groups ke beech ka variation unke andar ke random variation se bahut bada hai. p-value .001 se kam hone ka matlab hai ki statistically significant difference hai; kam se kam ek group ka average score dusron ke jaisa nahi hai.
Two-Way ANOVA aur Interactions
Ek two-way ANOVA aapko ek sath do factors test karne deta hai. For instance, aap teaching method aur student gender dono ko dekh sakte hain. Yahan, aap do cheezein check kar rahe hain:
Main effects: Kya teaching method, apne aap mein, scores ko affect karta hai? Kya gender, apne aap mein, scores ko affect karta hai?
Interaction effects: Kya teaching method ka effect gender par depend karta hai? Shayad ek method ek group ke liye dusre se bahut behtar kaam karta hai.
Balanced vs. Unbalanced Designs
Yeh part aapke sample sizes ke baare mein hai.
Ek balanced design mein har group mein equal number of observations hote hain (e.g., har teaching method mein 20 students).
Ek unbalanced design mein unequal group sizes hote hain.
Balanced designs simpler, zyada robust hote hain, aur aapko clearer results dete hain. Unbalanced designs math ko complicate kar sakte hain, aapke test ki sensitivity (statistical power) ko kam kar sakte hain, aur kabhi-kabhi interactions ko spot karna mushkil bana dete hain.
Reliable business ya research conclusions ke liye, ek balanced setup zyada behtar hai. Experimental design par Harvard Business Review ka ek piece note karta hai ki balanced groups se zyada interpretable comparisons hote hain aur bias ko minimize karne mein help milti hai.
Step 3: Samjhein Ki Post Hoc Tests Ki Zaroorat Kyun Hai
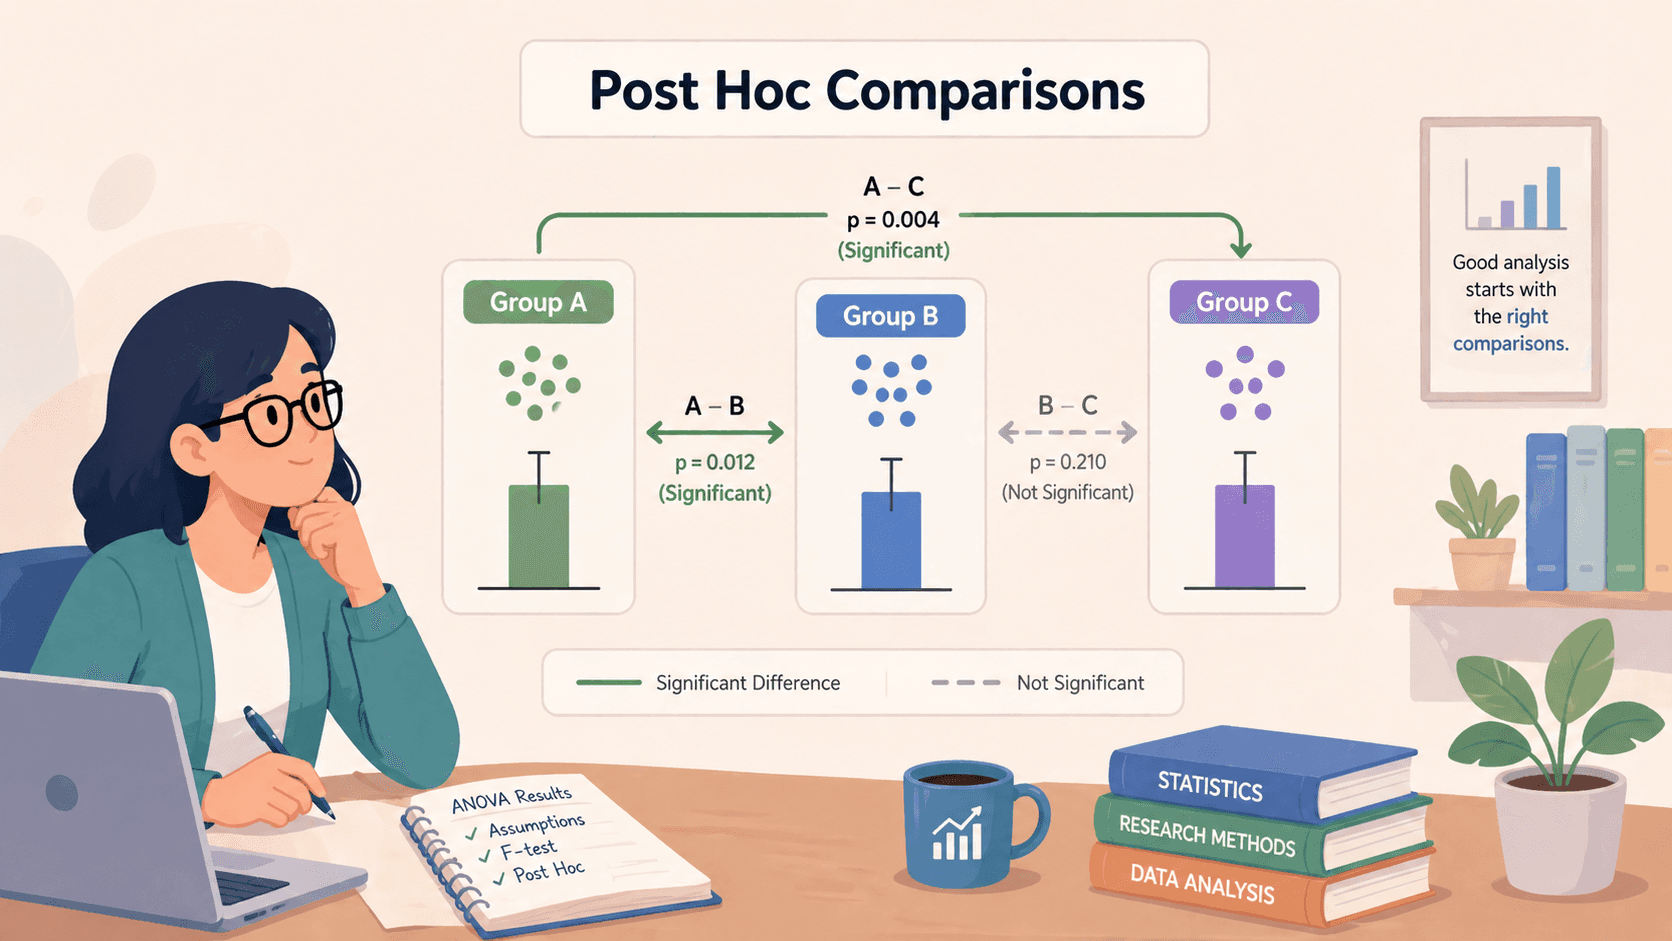
Ek significant ANOVA result sirf yeh batata hai ki sabhi group means equal nahi hain. Yeh aapko yeh nahi batata ki kaun se specific groups ek dusre se alag hain. Yeh pata lagane ke liye, aapko har possible pair of groups ke beech comparisons run karne honge.
Yeh ek statistical problem create karta hai. Agar aap har pair ke liye simply regular t-tests ki series run karte hain, toh aap false positive ka chance dramatically badha dete hain, yaani aisa difference dhundna jo actually exist hi nahi karta. Ise Type I error inflation kehte hain.
Post hoc tests isi ko solve karne ke liye hain. Woh aapke liye woh saare pairwise comparisons karte hain, lekin woh har individual test ke liye significance level ko adjust karte hain taaki pure experiment ka overall error rate aapke chosen alpha level (usually 0.05) par rahe.
Post Hoc Tests Actually Kya Karte Hain
Har group ko har dusre group se compare karte hain
Consistent overall error rate maintain karne ke liye corrections apply karte hain
Adjusted p-values provide karte hain jin par aap trust kar sakein
Aapko interpret karne mein help karte hain ki kaun se differences statistically meaningful hain
Practical terms mein, yeh aapko risk badhaye bina apne ANOVA results mein deeper dig karne dete hain. Aapko abhi bhi detailed comparisons milte hain, lekin safeguards ke sath.
Ek Common Research Frustration
Yeh bahut common hai, aur perfectly normal hai, ki ek significant overall ANOVA result mile aur uske baad post hoc tests mein koi significant pairwise differences na milein. Yeh koi mistake ya contradiction nahi hai. Iska matlab usually yeh hota hai ki aapki study ke paas limited statistical power thi.
Yahan usually yeh ho raha hota hai:
Limited statistical power: Aapka sample size shayad pairwise differences detect karne ke liye bahut chhota hai
Small effect sizes: Groups ke beech differences exist karte hain, lekin woh subtle hain
High within-group variability: Data mein noise clear differences ko isolate karna mushkil bana deta hai
Toh jabki groups ke beech overall variation detect karne ke liye kafi strong hai, individual comparisons corrections apply hone ke baad threshold pass nahi kar pate.
Yeh ek reminder hai ki ANOVA aur post hoc tests thode alag questions ke answer dete hain. Ek batata hai agar kuch ho raha hai, dusra batata hai exactly kahan, aur kabhi-kabhi, data use cleanly pin down karne ke liye kafi strong nahi hota.
<ProTip title="⚠️ Warning:" description="Do not run multiple t tests after ANOVA without correction methods." />
Step 4: Sahi Post Hoc Test Chunein
Sahi post hoc test chunna critical hai. In adjustments ke peeche ki specific math ko deeply samajhne ke liye, aap post hoc tests anova par is detailed resource ko explore kar sakte hain.
Common Post Hoc Tests Ka Comparison
Test | Best Use Case | Conservativeness | Key Feature |
Tukey HSD | Group means ke sabhi possible pairs ko compare karna. | Moderate | Sabh pairwise comparisons ke liye familywise error rate ko control karta hai. |
Bonferroni | Jab aapke paas sirf kuch hi, pre-planned comparisons hon. | Very High | Simple method: aapke alpha level (e.g., 0.05) ko tests ke number se divide karta hai. |
Dunnett | Kayi treatment groups ko ek single control group se compare karna. | Moderate | Is specific, focused purpose ke liye Tukey se zyada powerful hai. |
Scheffé | Complex, unplanned contrasts ko test karna (e.g., do groups ke average ko teesre se compare karna). | Extremely High | Very flexible hai lekin bahut conservative bhi hai, jo power ko kam karta hai. |
Tukey HSD in Practice
Tukey's Honestly Significant Difference (HSD) yadatar situations ke liye default choice hai, khaskar jab aapke paas balanced designs (equal sample sizes) hon.
Yeh real differences find karne ke liye reasonable statistical power maintain karte hue overall error rate ko effectively control karta hai.
Bonferroni Simplicity
Bonferroni correction ko samajhna aur apply karna simple hai: aap apna desired alpha level lete hain aur ise jitne comparisons aap kar rahe hain us number se divide kar dete hain.
Iska bada drawback yeh hai ki jab aapke paas bahut saare groups hote hain toh yeh bahut strict ho jata hai, jisse koi significant result find karna bahut mushkil ho jata hai.
Games-Howell Kab Use Karein
Agar aapka Levene's test groups mein unequal variances indicate karta hai, toh Tukey ya Bonferroni use na karein. Iske bajaye, Games-Howell test use karein.
Yeh equal variances assume nahi karta aur in situations mein robust, reliable pairwise comparisons provide karta hai, jo galat conclusions ko rokta hai.
<ProTip title="🧠 Note:" description="Match your post hoc test to your ANOVA design and data conditions." />
Step 5: Results Ko Sahi Se Interpret Karein
Apne results ko read karne ka matlab hai sirf p-values se aage dekhna. Ek significant p-value aapko batata hai ki ek difference statistically detectable hai, lekin yeh nahi ki kya yeh practice mein matter karne jitna bada hai.
Pairwise Differences Par Focus Karein
Yeh aapke post hoc test ka core output hai. Yeh aapko exactly dikhayega ki kaun se groups ek dusre se alag hain. Aapke results kuch aise dikh sakte hain:
Group A vs. Group B: p = .003 (Significant)
Group A vs. Group C: p = .015 (Significant)
Group B vs. Group C: p = .210 (Not Significant)
Yeh aapko batata hai ki Group A mein treatment B ya C se alag tarike se kaam karta hai, lekin groups B aur C ne similarly perform kiya.
Effect Sizes Ko Include Karein
Ek p-value significant ho sakta hai bhale hi groups ke beech ka actual difference bahut chhota ho. Effect size us difference ke magnitude ko measure karta hai. ANOVA ke liye common measures Eta squared (η²) ya Partial Eta squared hain.
Woh aapko batate hain ki total variance ka kitna proportion aapke independent variable se explain hota hai. Ek tiny η² ke sath ek bada, significant p-value often ek trivial finding ko show karta hai.
Confidence Intervals Matter Karte Hain
Mean differences ke liye hamesha confidence intervals check karein. Ek 95% CI aapko do group means ke beech ke true difference ki ek plausible range deta hai. Ek wide interval uncertainty suggest karta hai, bhale hi p-value significant ho.
Ek interval jisme zero include nahi hota woh significance ko confirm karta hai, lekin uski bounds aapko effect ka potential size dikhati hain, jo akele p-value se kahin zyada useful information provide karti hain.
Step 6: Advanced ANOVA Designs Ko Handle Karein
Standard one-way ANOVA har research scenario ko cover nahi karega. Zyada complex designs common hain aur unke liye specific approaches ki zaroorat hoti hai.
Repeated Measures ANOVA
Ise tab use karein jab aap same group of people ya subjects ko alag-alag conditions ke under multiple times measure karte hain, jaise treatment ke pehle, beech mein, aur baad mein patient pain levels ko test karna.
Yahan ek key assumption sphericity hai, jise aap Mauchly’s test se check karte hain. Agar woh test fail hota hai, toh aap apne degrees of freedom par ek correction apply karte hain.
Do main corrections Greenhouse-Geisser (zyada conservative) aur Huynh-Feldt (kam conservative) corrections hain.
Mixed ANOVA Models
Yeh design same analysis mein between-subjects aur within-subjects factors ko mix karta hai. For example, aap do alag training programs (between-subjects) ko four weekly assessments (within-subjects) mein compare kar sakte hain.
Yeh longitudinal studies ya alag groups ke beech pre-test/post-test design wale experiments ke liye ek powerful tool hai.
Factorial ANOVA Designs
Ek factorial ANOVA tab use hota hai jab aapke paas do ya usse zyada independent variables (factors) hote hain. Ek 2x2 design, for instance, aapko Factor A ke effect, Factor B ke effect, aur critically, A aur B ke beech ke interaction effect ko analyze karne deta hai.
Yeh woh jagah hai jahan aap dekhte hain ki kya ek variable ka effect dusre ke level par depend karta hai, jo aksar aapke data se sabse interesting insights provide karta hai.
Common Mistakes Jo Researchers Karte Hain
Problems usually tab hoti hain jab log theory ko practice mein dalne ki koshish karte hain.
Cheezon Ko Bahut Zyada Complicate Karna
Sirf P Value Ko Dekhna
Kuch papers results section mein bas ek p-value daal dete hain aur bas ho gaya. Yeh aapko is baare mein zyada nahi batata ki kya finding actually kisi practical sense mein matter karti hai.
Post-Hoc Tests Galat Tarike Se Karna
Agar aapka initial ANOVA significant nahi tha toh aap bas dher saare post-hoc comparisons nahi run kar sakte. Aur kuch "significant" dikhne wali cheez ko dhoodhne ke liye baad mein apne data ke beech hunting karna ek bad habit hai.
Apne Assumptions Check Na Karna
Yeh shayad sabse common slip-up ho sakta hai. Agar aap normality ya equal variances jaise cheezon ko verify nahi karte, toh pura analysis ek shaky ground par bana hota hai.
<ProTip title="🚀 Strategy:" description="Plan your contrasts before running ANOVA to avoid data fishing." />
Jab Aapke Results Ko Jaldi Samajh Mein Aana Ho
Aap outputs ko ghoor rahe hain, yeh samajhne ki koshish kar rahe hain ki kya matter karta hai, lekin numbers messy aur explain karne mein mushkil lag sakte hain. Yeh confusing ho jata hai. Ek clear approach ke bina, apne results par doubt karna ya data sach mein kya keh raha hai use miss karna easy hai.
<CTA title="Strengthen Your Statistical Workflow" description="Turn complex analysis into clear steps with guided writing and structured prompts." buttonLabel="Try Jenni Free" link="https://app.jenni.ai/register" />
Wahan Jenni aapko cheezon ko sort karne aur unhe ek clear tarike se present karne mein help kar sakti hai. Yeh aapke analysis ko likhne aur explain karne ke tareeqe ko support karti hai taaki aapki findings hold together karein. Guess karne ke bajaye, aap un results ke sath aage badhte hain jin par trust karna aur share karna aasan hota hai.