Por
Justin Wong
—
Una Guía Clara para Escribir la Sección de Metodología de tu Trabajo de Investigación

Justin Wong
Jefe de Crecimiento
Graduado con una Licenciatura en Negocios Globales y Artes Digitales, con un Minor en Emprendimiento

La sección de metodología es donde muestras exactamente cómo se llevó a cabo tu estudio y por qué cada decisión encaja con tus objetivos de investigación. Explica tu diseño, herramientas, participantes y procedimientos de una manera que ayuda a los lectores a juzgar la calidad y la fiabilidad de tu trabajo.
Esta guía desglosa cada parte de la metodología para que puedas redactarla con claridad y confianza. Aprenderás a describir tu diseño de investigación, perfilar tus pasos y presentar tu análisis de datos. Justifica tus decisiones sin complicar el proceso. Ya sea que estés trabajando en una tesis, una disertación o un artículo de revista, esta sección se sitúa junto a otros componentes esenciales — consulta nuestro desglose de las partes esenciales de un trabajo de investigación — y la estructura aquí te ayudará a mantenerte organizado.
<CTA title="Redacta una metodología de investigación clara rápidamente" description="Usa indicaciones basadas en esquemas para construir con facilidad una sección de métodos estructurada y lista para revisión" buttonLabel="Probar Jenni gratis" link="https://app.jenni.ai/register" />
1. Comienza con una visión general clara del diseño de tu estudio
Los lectores necesitan una imagen rápida del tipo de estudio que están viendo. Por eso tu sección de métodos debe empezar con una breve visión general de tu diseño de estudio. Piensa en esto como un mapa en un solo párrafo.
En esta visión general del diseño, debes indicar brevemente:
Tipo de investigación: cualitativa, cuantitativa o de métodos mixtos.
Enfoque filosófico o teórico: por ejemplo: positivista, constructivista, pragmático, interpretativo.
Marco temporal: transversal, longitudinal, estudio de caso u otro marco basado en el tiempo.
Entorno o contexto: como una escuela, clínica, plataforma en línea, laboratorio o comunidad.
Propósito central: qué estabas tratando de descubrir o comprender en términos simples.
Una buena visión general no entra en largos detalles. Ofrece justo lo suficiente para que, cuando los lectores avancen a las siguientes secciones, ya entiendan la lógica básica detrás de tus decisiones.
Cómo elegir el diseño de investigación adecuado
El diseño debe ajustarse a la pregunta que estás planteando. Esta relación puede explicarse brevemente en una o dos frases concisas.
El enfoque que elijas depende de tu pregunta de investigación.
Los diseños cuantitativos funcionan mejor cuando quieres:
Medir variables
Poner a prueba hipótesis
Examinar relaciones mediante estadística
Los diseños cualitativos son mejores cuando quieres:
Explorar experiencias o significados
Comprender cómo las personas dan sentido a los acontecimientos
Estudiar procesos en profundidad en lugar de números
Los diseños de métodos mixtos son útiles cuando:
Quieres tanto tendencias numéricas como relatos ricos
Necesitas que un tipo de datos ayude a explicar el otro
Puedes tomar como modelo tus propias frases a partir de estos ejemplos:
Cuantitativo:
“Este estudio utilizó un diseño cuantitativo transversal de encuesta para examinar los predictores del agotamiento académico en estudiantes de primer año de universidad.”
Cualitativo:
“Se adoptó un enfoque fenomenológico para explorar cómo los cuidadores interpretan y gestionan la fatiga emocional mientras brindan cuidados al final de la vida.”
Métodos mixtos:
“La investigación utilizó un diseño secuencial explicativo de métodos mixtos, comenzando con una encuesta a gran escala y seguida de entrevistas dirigidas con participantes seleccionados.”
<ProTip title="💡 Consejo profesional:" description="Comienza tu metodología resumiendo todo tu enfoque de investigación en un párrafo breve antes de ampliar los detalles" />
Por qué esto importa
Una visión general concisa del diseño garantiza que los lectores comprendan la estructura de tu estudio antes de encontrarse con detalles técnicos. También indica que tu método se ajusta lógicamente a tus objetivos de investigación, lo cual es una parte clave de la evaluación académica.
2. Describe a tus participantes o fuentes de datos
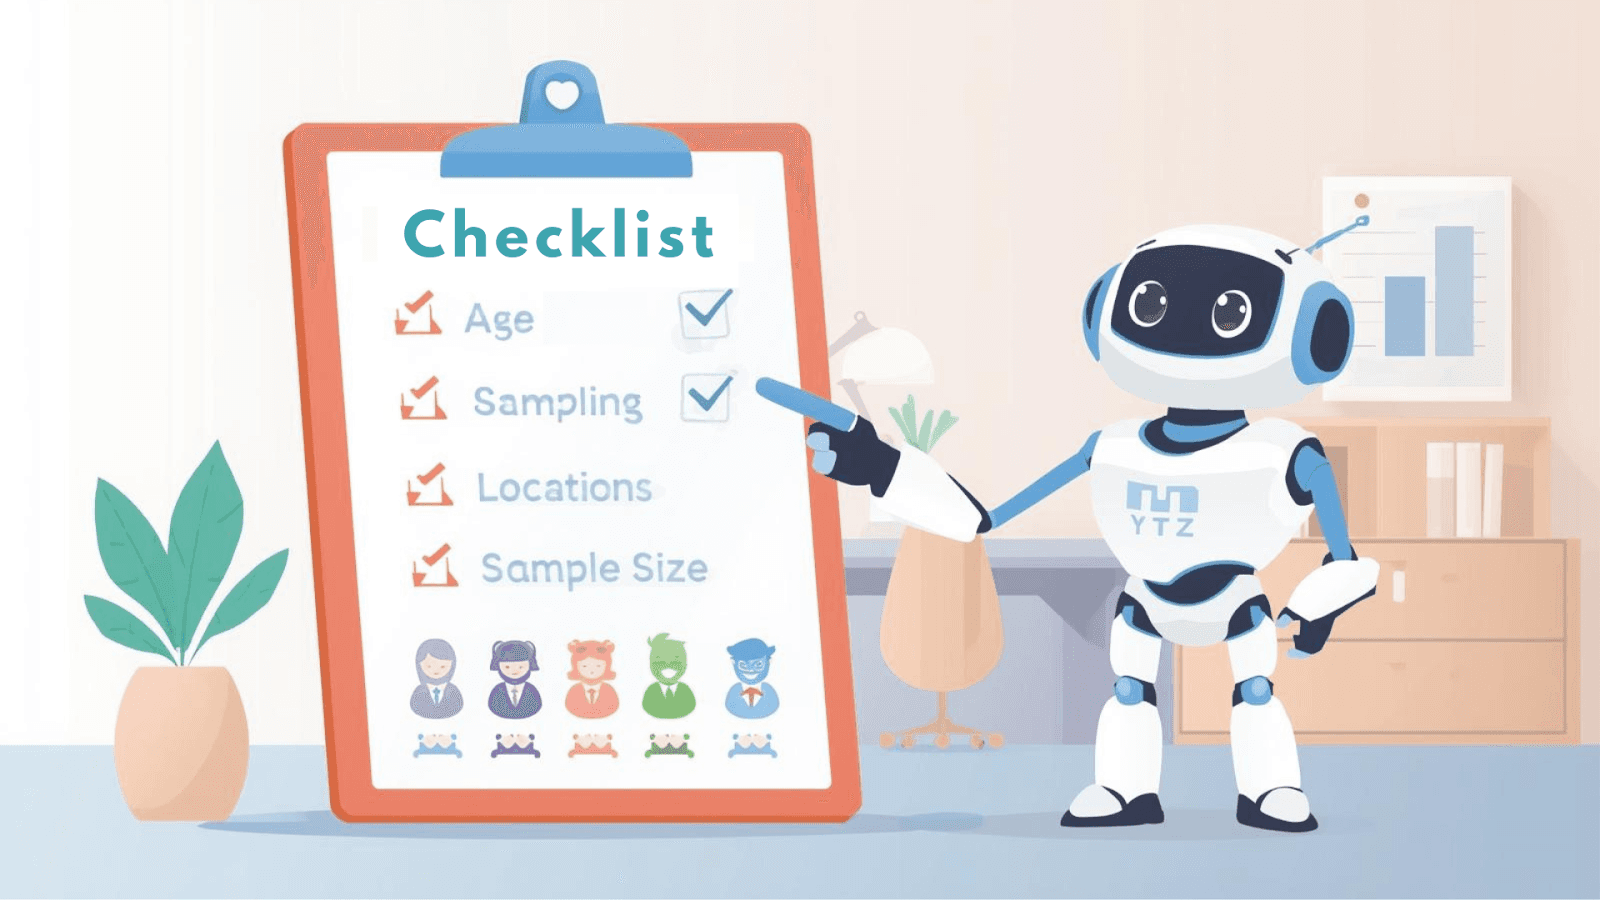
Después del diseño, los lectores quieren saber a quién o a qué estudiaste. Esta sección explica a tus participantes o fuentes de datos y por qué fueron una buena opción para tu pregunta de investigación.
Estudios basados en participantes
Si tu investigación involucra personas, empieza indicando cuál es el grupo objetivo y por qué encaja con tu pregunta. Luego ofrece detalles concretos, no etiquetas vagas.
Debes incluir:
Tamaño total de la muestra - ¿Cuántos participantes formaron parte del estudio?
Método de muestreo - Cómo los elegiste (por ejemplo: aleatorio, intencional, por conveniencia).
Información demográfica - Rango de edad, género, ocupación, ubicación u otros rasgos relevantes.
Criterios de inclusión y exclusión - Quién podía participar y quién no, y por qué.
Estrategia de reclutamiento - Dónde y cómo encontraste a los participantes.
Explica siempre por qué elegiste un determinado método de muestreo. Los revisores se fijan mucho en este punto porque el muestreo afecta la validez y la equidad.
Técnicas de muestreo (guía breve)
Las decisiones de muestreo cambian cuánto se pueden confiar o generalizar tus resultados. Aquí tienes métodos comunes en un formato sencillo:
Método de muestreo | Descripción | Uso ideal |
Muestreo aleatorio simple | Igual oportunidad para todos los miembros | Estudios cuantitativos grandes |
Muestreo sistemático | Se selecciona cada enésima persona | Poblaciones con listas completas |
Muestreo estratificado | Se divide primero en subgrupos | Estudios que requieren equilibrio demográfico |
Muestreo por conglomerados | Se seleccionan grupos en lugar de individuos | Muestras dispersas geográficamente |
Muestreo intencional | El investigador selecciona según rasgos | Trabajo cualitativo con fuerte carga de expertos |
Muestreo en bola de nieve | Los participantes reclutan a otros | Poblaciones ocultas o sensibles |
Muestreo por conveniencia | Participantes disponibles con mayor facilidad | Proyectos estudiantiles y estudios piloto |
Criterios de inclusión y exclusión
Deja claro por qué existen tus límites. Una sola frase breve puede servir de base y luego pasas a los detalles.
Ejemplo:
“Los criterios de inclusión requerían que los participantes tuvieran al menos seis meses de experiencia trabajando a distancia. Se excluyó a las personas con horarios exclusivamente híbridos para mantener el enfoque en trabajadores remotos de tiempo completo.”
Estrategia de reclutamiento
Describe cómo encontraste e invitaste a los participantes para que otro investigador pudiera intentar hacer algo similar. Podrías mencionar:
Listas de correo o tablones de anuncios del campus
Grupos en redes sociales o foros en línea
Unidades de clínicas u hospitales
Centros comunitarios u organizaciones
Plataformas de crowdsourcing en línea
Proporciona suficientes detalles para que el proceso quede claro, pero no reveles identidades personales.
Para fuentes de datos no humanas
Algunos estudios no involucran personas en absoluto. Si ese es tu caso, dilo con claridad y explica en su lugar tus fuentes de datos.
Podrías haber utilizado:
Documentos o registros de archivo
Informes organizacionales
Conjuntos de datos o estadísticas públicas
Textos históricos o contenidos de medios
Muestras químicas o ambientales
Sistemas tecnológicos o biológicos
En estos casos, explica:
De dónde provinieron los datos
Cómo accediste a ellos
Cómo elegiste qué elementos incluir
Cualquier regla para incluir o excluir datos
<ProTip title="📌 Recordatorio:" description="Describe siempre tus criterios de selección antes que el número de participantes para que tu lógica quede clara" />
3. Detalla los materiales, herramientas e instrumentos
La siguiente pregunta que se hacen los lectores es: ¿Qué usaste para recopilar y medir tus datos? Esta sección describe tus materiales e instrumentos para que otros puedan juzgar si tus herramientas fueron precisas, justas y adecuadas.
Puedes organizar esta sección por tipo de herramienta.
Categorías comunes de materiales
Sigue esa orientación con una lista y un breve contexto para cada categoría.
Encuestas o cuestionarios
Indica si fueron elaborados por el investigador o herramientas validadas, además de las estadísticas de fiabilidad si están disponibles.Guías de entrevista
Ofrece una breve explicación de cómo se desarrollaron las preguntas, cómo se alinearon con la pregunta de investigación y cómo se pilotaron.Instrumentos de laboratorio
Incluye modelos, precisión de medición, pasos de calibración, integraciones de software y estándares de pureza química.Herramientas de software
Ejemplos:
SPSS, STATA, R
NVivo, Atlas.ti, MAXQDA
MATLAB
Bibliotecas de Python (NumPy, SciPy, pandas)
Qualtrics o SurveyMonkey
Párrafo de ejemplo:
“La ansiedad se midió utilizando la Escala de Trastorno de Ansiedad Generalizada (GAD-7), una herramienta validada de 7 ítems ampliamente usada en estudios clínicos y poblacionales.”
Explica por qué elegiste estas herramientas
Tus lectores nunca deberían quedarse preguntándose: “¿Por qué ese instrumento y no otro?”. Así que añade una breve justificación y conecta tus decisiones con estudios previos en la sección de revisión de la literatura de un trabajo de investigación.
Ejemplo:
“Estas herramientas se seleccionaron debido a su fiabilidad comprobada en estudios previos que examinaban el estrés y los resultados de salud.”
Por qué esto importa
Las herramientas bien descritas ayudan a los lectores a confiar en tus datos y a evaluar la fiabilidad de tu estudio. También permiten que futuros investigadores repliquen tus métodos con mayor precisión.
<ProTip title="💡 Nota:" description="Cuando uses instrumentos estandarizados, cita la publicación original para confirmar la validez" />
4. Explica los procedimientos paso a paso
Esta suele ser la sección más larga de la metodología porque describe exactamente lo que ocurrió en el estudio. La clave es la claridad cronológica.
Qué debe cubrir tu sección de procedimientos
Una sección clara de procedimientos debe detallar:
La secuencia de pasos de tu estudio
La duración de cada etapa principal
Cómo se administraron o aplicaron las intervenciones
Cómo obtuviste el consentimiento informado
Qué instrucciones recibieron los participantes
Cómo manejaste, almacenaste y depuraste los datos
Cualquier ajuste realizado cuando las cosas no salieron como se esperaba
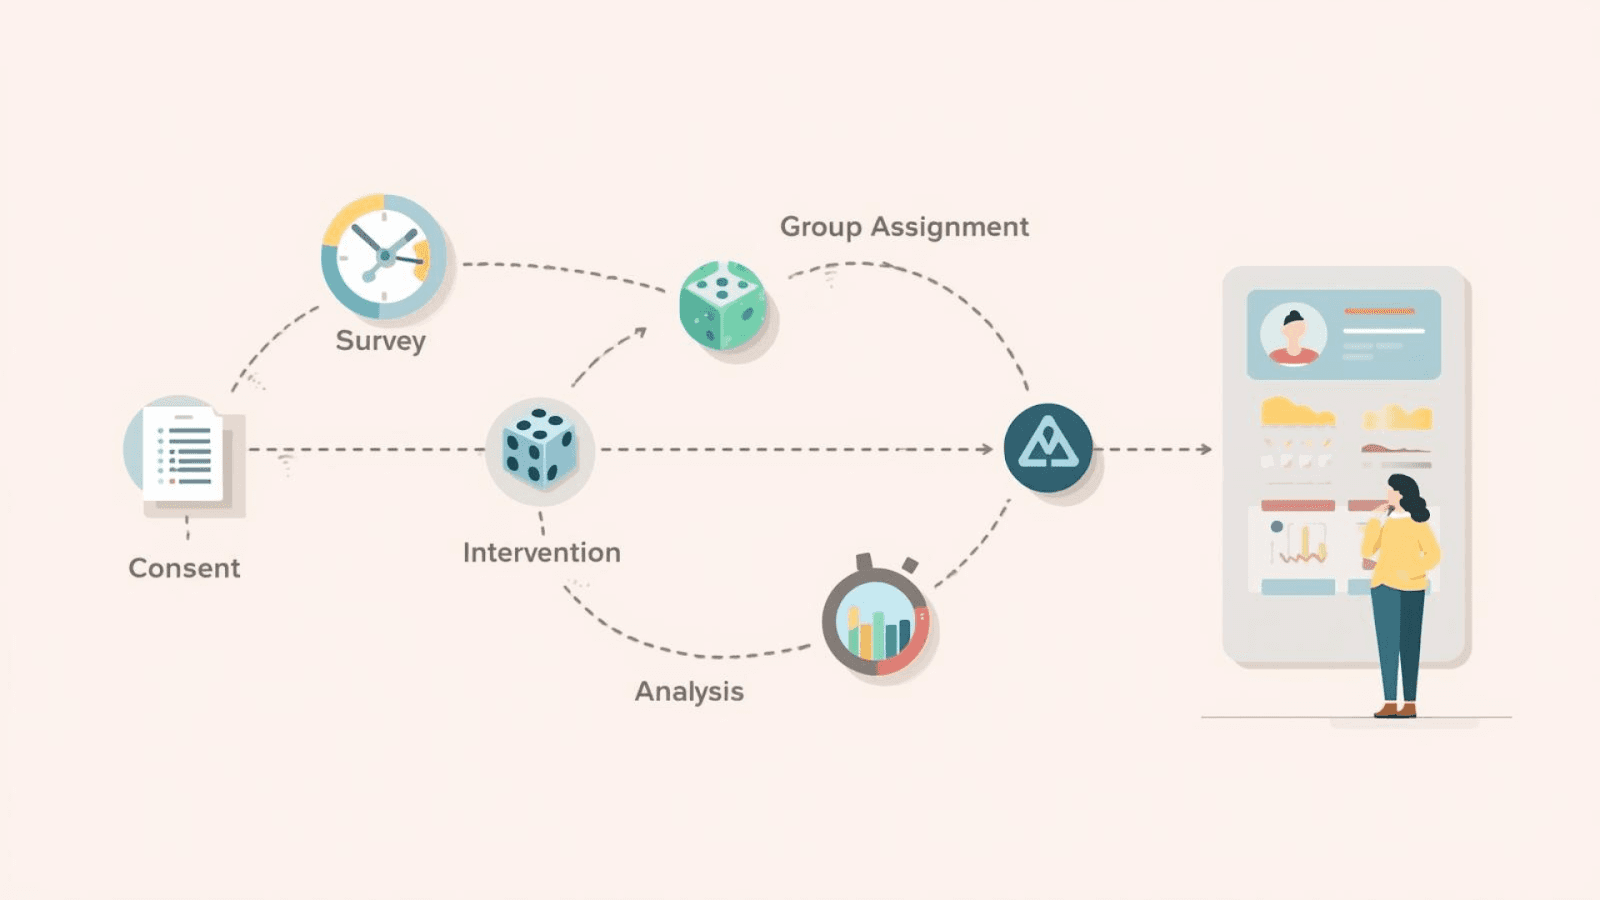
Un ejemplo cronológico
Introduce el ejemplo con una orientación de una sola línea y luego muestra la cronología.
Se enviaron correos iniciales con el enlace de la encuesta a todos los participantes elegibles.
Los participantes accedieron al formulario digital de consentimiento y aceptaron electrónicamente.
Completaron un cuestionario de línea base que recogía datos demográficos, estado de ánimo y hábitos de sueño.
Los participantes fueron asignados aleatoriamente a un grupo de control o experimental mediante una secuencia generada por computadora.
El grupo de intervención asistió a sesiones semanales de mindfulness de 45 minutos durante cuatro semanas.
Investigación experimental
En los experimentos, los detalles importan mucho porque afectan la validez interna. Asegúrate de explicar:
El método de aleatorización
Cualquier enmascaramiento o doble enmascaramiento utilizado
Qué hizo o recibió el grupo de control
La dosis, duración e intensidad de las intervenciones
Cómo se configuró y supervisó el equipo
Estos detalles ayudan a los lectores a juzgar si tus resultados realmente provinieron de la intervención y no de factores externos.
Investigación cualitativa
En el trabajo cualitativo, el contexto y el papel del investigador son muy importantes. En este caso, debes describir:
Dónde tuvieron lugar las entrevistas, grupos focales u observaciones
Cuánto duró cada sesión
Cómo registraste (audio, video, notas) y transcribiste los datos
Cualquier paso de reflexividad, como llevar un diario de investigación o comentar tu papel con colegas
Ejemplo:
“Las entrevistas se realizaron en una sala de reuniones privada, duraron entre 45 y 60 minutos y se grabaron en audio con permiso. Se produjeron transcripciones literales utilizando Otter.ai y se verificaron manualmente para asegurar su exactitud.”
<ProTip title="💬 Consejo profesional:" description="Usa de forma consistente verbos en pasado en todos tus procedimientos para ajustarte a los estándares académicos" />
5. Describe tus métodos de recopilación de datos
Aunque describas los procedimientos, todavía necesitas una explicación específica de la recopilación de datos. Esto aclara exactamente qué recopilaste y cómo.
Métodos comunes de recopilación de datos
Introduce la lista con una línea sobre la adecuación del método y luego enumera métodos comunes:
Encuestas y cuestionarios - Adecuados para muestras grandes y análisis estadístico.
Entrevistas y grupos focales - Ideales para comprender perspectivas o experiencias.
Observaciones y notas de campo - Usadas en etnografía y teoría fundamentada.
Datos secundarios o de archivo - Incluyen documentos de políticas, informes financieros, registros clínicos o conjuntos de datos en línea. Todos ellos pueden funcionar como fuentes primarias o datos secundarios según cómo se utilicen dentro del estudio.
Experimentos - Ideales para probar relaciones de causa y efecto.
Párrafo de ejemplo
“Los datos se recopilaron mediante una encuesta en línea autoadministrada alojada en Qualtrics. Los participantes tuvieron dos semanas para completar el cuestionario, con correos de recordatorio enviados los días 5 y 10. La plataforma exportó automáticamente las respuestas a SPSS para su depuración.”
<ProTip title="🧭 Idea clave:" description="Justifica siempre por qué el método elegido encaja con tu pregunta de investigación" />
6. Explica tus técnicas de análisis de datos
Los lectores quieren saber cómo tus datos brutos se transformaron en hallazgos significativos. Esta sección varía según si tu estudio es cuantitativo o cualitativo.
Análisis de datos cuantitativos
El análisis cuantitativo requiere explicar el preprocesamiento, las pruebas estadísticas y los umbrales.
En estudios cuantitativos, debes explicar:
Qué software utilizaste (SPSS, R, STATA, JASP, etc.)
Cómo depuraste los datos (tratamiento de valores perdidos, valores atípicos, errores)
Qué pruebas estadísticas aplicaste
El nivel de significancia que usaste (a menudo p < 0,05)
Si comprobaste supuestos como la normalidad o la igualdad de varianzas
Cualquier intervalo de confianza o medida del tamaño del efecto que reportaste
Pruebas estadísticas comunes
Introduce con una frase sobre la adecuación de las pruebas a los datos y las hipótesis, y luego muestra una lista compacta en formato de tabla:
Prueba | Propósito |
pruebas t | Comparar dos medias |
ANOVA | Comparar múltiples medias |
Regresión | Predecir relaciones |
Pruebas chi-cuadrado | Comparar variables categóricas |
Correlación | Fuerza de las relaciones |
Párrafo de ejemplo:
“Los datos se analizaron utilizando SPSS versión 28. Las estadísticas descriptivas resumieron las variables demográficas. Las pruebas t para muestras independientes evaluaron las diferencias en las puntuaciones de estrés entre grupos. La significancia estadística se estableció en p < 0,05.”
Análisis de datos cualitativos
En el análisis cualitativo, el enfoque está en los temas, los patrones y los significados de los datos. En esta sección, explica:
Qué enfoque analítico utilizaste:
Análisis temático
Análisis de contenido
Teoría fundamentada
Análisis narrativo
Análisis del discurso
Si tu codificación fue:
Inductiva (códigos desarrollados a partir de los datos)
Deductiva (códigos basados en la teoría o en un marco previo)
Cualquier herramienta de software utilizada (NVivo, Atlas.ti, MAXQDA, etc.)
Ejemplo:
“Las transcripciones se codificaron de forma inductiva usando NVivo. El análisis temático siguió el enfoque de seis fases de Braun y Clarke, comenzando con la familiarización y terminando con el refinamiento de temas.”
Análisis de métodos mixtos
Si utilizaste métodos mixtos, explica cómo vinculaste las partes cuantitativa y cualitativa.
Diseños comunes:
Secuencial: primero se recopila y analiza un tipo de datos y luego se usa para orientar la siguiente fase.
Convergente: ambos tipos se recopilan al mismo tiempo, se analizan por separado y luego se comparan.
Integrado: un tipo de datos está incrustado dentro del otro (por ejemplo, unas pocas entrevistas dentro de un ensayo grande).
Ejemplo:
“Los hallazgos cuantitativos de la encuesta dieron forma a la guía de entrevistas, asegurando que las perspectivas cualitativas ampliaran las tendencias estadísticas iniciales. Los resultados se integraron durante la interpretación para comparar la convergencia y la divergencia entre conjuntos de datos.”
<ProTip title="🗂️ Recordatorio:" description="Indica si tu análisis utilizó codificación deductiva o inductiva para aclarar tu postura analítica" />
7. Aborda las consideraciones éticas
Toda sección de metodología debe incluir una breve parte ética que muestre que tu estudio siguió las normas y protegió a las personas y los datos.
Puntos clave que cubrir:
Aprobación del comité de ética o del IRB, nombre del comité y el número de aprobación si lo tienes.
Procedimientos de consentimiento: cómo se informó a los participantes y cómo aceptaron.
Confidencialidad y anonimato: cómo eliminaste o protegiste los identificadores personales.
Protección de datos, almacenamiento, control de acceso y cuánto tiempo se conservarán los datos.
Salvaguardas para grupos vulnerables. Cualquier cuidado adicional tomado con menores, pacientes u otros grupos en riesgo.
Ejemplo de ética
“La investigación fue aprobada por el Comité de Revisión Institucional (IRB) de la Facultad de Ciencias Sociales (Código de aprobación: 2024-SSI-117). Se informó a los participantes sobre sus derechos, incluida la participación voluntaria y la posibilidad de retirarse sin consecuencias.
Todos los datos se almacenaron en unidades cifradas a las que solo podía acceder el equipo de investigación. Los identificadores se eliminaron antes del análisis y se utilizaron seudónimos en todas las transcripciones.”
<ProTip title="🔒 Consejo profesional:" description="Incluye siempre tu número de protocolo o aprobación ética si tu institución emite uno" />
8. Explica las limitaciones de tu estudio
Una metodología creíble reconoce dónde puede quedarse corta tu aproximación. Esto fortalece tu integridad académica.
Tipos de limitaciones metodológicas
Una metodología sólida también admite sus límites. Esto no debilita tu estudio; demuestra que entiendes sus fronteras.
Limitaciones metodológicas comunes:
Muestra pequeña o local
Muestreo por conveniencia o no aleatorio
Datos autoinformados
Marco temporal corto o fijo
Acceso limitado a algunos grupos o registros
Posible sesgo del investigador
Herramientas que no captan todos los detalles
Ejemplo:
“Debido a que el estudio utilizó cuestionarios de autoinforme, las respuestas pueden estar influenciadas por el sesgo de deseabilidad social. Además, la muestra se obtuvo de una sola universidad, lo que puede restringir la generalización a poblaciones estudiantiles más amplias.”
9. Organiza tu metodología con subtítulos claros
Empieza recordando a los lectores que la estructura equivale a legibilidad; los subtítulos guían la evaluación y la replicación.
Una estructura clara ayuda a los lectores a seguir tu lógica. Un esquema típico es:
Diseño del estudio
Participantes / fuentes de datos
Materiales e instrumentos
Procedimientos
Recopilación de datos
Análisis de datos
Consideraciones éticas
Limitaciones
Antes de seguir, comprueba:
¿Podría otro investigador repetir mi estudio usando solo esta sección?
¿Expliqué por qué usé cada método principal, y no solo qué hice?
¿Señalé algún estándar de reporte, como CONSORT, PRISMA, STROBE o COREQ, si corresponde?
10. Cómo hacer que tu metodología sea clara, rigurosa y replicable
Esta sección final se centra en la calidad. Incluso los estudios bien diseñados pueden verse afectados si la metodología no es clara.
Antes de finalizar tu capítulo, usa esta lista de control de calidad.
Lista de claridad
Pregúntate:
¿Está explicado cada paso en pasado?
¿Están correctamente nombradas todas las herramientas e instrumentos?
¿Redactaste en orden cronológico?
Lista de justificación
Confirma:
¿Explicaste por qué se eligió cada método?
¿Justificaste tu estrategia de muestreo?
¿Explicaste tu marco analítico?
Lista de replicabilidad
Verifica:
¿Podría otro investigador repetir tu estudio basándose solo en esta sección?
¿Están tus materiales descritos con suficiente detalle?
Lista ética
Comprueba de nuevo:
¿Documentaste la aprobación?
¿Abordaste la confidencialidad y la protección de datos?
Lista de transparencia
Asegúrate:
¿Incluiste limitaciones razonables?
¿Mencionaste los estándares de reporte (CONSORT, PRISMA, STROBE, COREQ) si los usaste?
<ProTip title="🧪 Nota:" description="Si tus métodos siguen una guía de reporte como PRISMA o CONSORT, indícalo explícitamente para mayor claridad" />
Cómo redactar una sección de metodología sólida en un trabajo de investigación
Una sección de metodología de un trabajo de investigación sólida muestra exactamente cómo se llevó a cabo tu estudio y por qué cada decisión respalda tus objetivos de investigación. Unos métodos claros hacen que tu trabajo sea creíble, replicable y más fácil de confiar para los revisores.
<CTA title="Crea una sección de métodos clara" description="Convierte tu diseño, pasos y proceso en una metodología estructurada y lista para publicar" buttonLabel="Probar Jenni gratis" link="https://app.jenni.ai/register" />
Si quieres ayuda para convertir tu diseño, procedimientos y análisis en una redacción académica pulida, Jenni puede ayudarte a construir una metodología más clara y lista para publicación en menos tiempo.