Oleh
Justin Wong
—
ANOVA and Post Hoc Tests: A Clear Step-by-Step Guide

Justin Wong
Head of Growth
Lulus dengan gelar Sarjana di bidang Global Business & Digital Arts, Minor di bidang Kewirausahaan
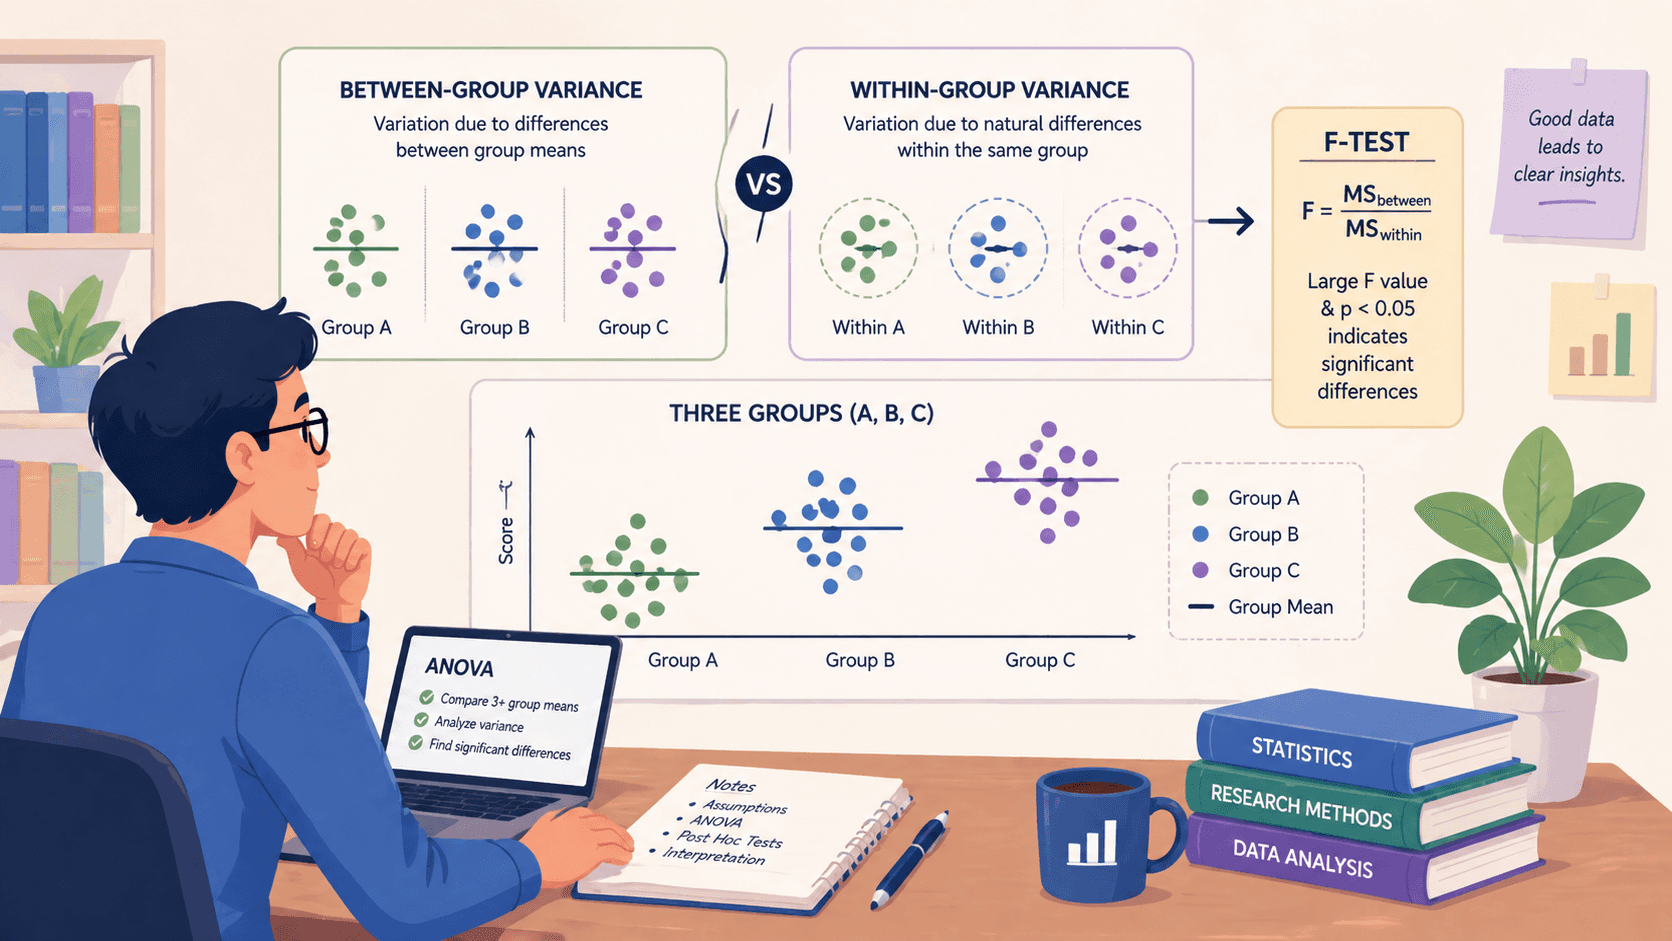
ANOVA and post hoc tests are essential for comparing three or more group means. Using repeated t-tests instead will inflate your false positive rate and compromise your findings.
This guide provides the complete workflow, from the basics of variance to selecting the correct post hoc test. You’ll learn to confidently run, interpret, and report your ANOVA results.
<CTA title="Analyze Data with Clarity" description="Structure your statistical workflow and interpret results faster with guided prompts." buttonLabel="Try Jenni Free" link="https://app.jenni.ai/register" />
What ANOVA Actually Tests
ANOVA, short for analysis of variance, checks if the average scores from three or more groups are genuinely different. It does this by comparing two types of variation.
To get a foundational grasp of these statistical structures, you might find the ultimate guide to anova helpful for visualizing how data groups interact.
The total variation in your data gets split into two pieces:
Between-group variance: The differences you see that might be caused by your treatments or conditions.
Within-group variance: The natural, random differences among individuals in the same group, essentially background noise.
The core calculation is the F-statistic. This is just the between-group variance divided by the within-group variance. A large F-statistic, with a p-value typically under 0.05, tells you the group differences are bigger than you'd expect from chance alone.
Breaking Down the Logic
A simple analogy is comparing test scores from different classrooms. If every class has a similar average score, the variation between classes is small. But if one class consistently scores much higher, that between-class variation shoots up.
ANOVA quantifies that effect. This objective approach is a hallmark of qualitative vs quantitative research, where numerical data is used to prove or disprove a hypothesis.
Key Components in the ANOVA Table
You'll find these elements in a standard ANOVA output:
Sum of Squares (SS): The total squared variation.
Degrees of Freedom (df): The number of independent pieces of information.
Mean Squares (MS): The average variation (SS/df).
F statistic: The final ratio (MS between / MS within) used for the significance test.
Each part helps you figure out if the differences you see are meaningful or just random noise.
<ProTip title="💡 Pro Tip:" description="Always report effect size like eta squared alongside p values for stronger interpretation." />
Step 1: Check ANOVA Assumptions First
Don't run an ANOVA without checking its core assumptions first. Skipping this step can easily give you misleading results.
The Three Core Assumptions
ANOVA depends on three conditions being reasonably met:
Normality: Your data should roughly follow a normal distribution.
Homogeneity of variance: The spread of scores (variance) should be similar across all groups.
Independence: Each observation must be unrelated to the others.
These aren't just formalities, they prevent you from drawing biased or incorrect conclusions.
How to Test Them in Practice
For normality, look at a Q-Q plot of the residuals or run a Shapiro-Wilk test.
For homogeneity of variance, Levene’s test is the most common check.
Independence isn't tested statistically; it’s a feature of your study design. Make sure your data wasn't collected in a way that links one observation to another.
This is why learning how to write a research question effectively is vital, it ensures your experimental setup is logically sound from the start.
What If Assumptions Fail?
If your data breaks these rules, you need a different test.
If variances are unequal, use you should look into welch and brown forsythe one way anova.
If the data isn't normal, the Kruskal-Wallis test is a good non-parametric alternative.
For repeated measures where independence fails, consider the Friedman test.
Ignoring these checks is a common mistake. For instance, a National Institutes of Health review notes that violating ANOVA assumptions in biomedical research can seriously distort reported significance levels.
<ProTip title="📊 Reminder:" description="Small sample sizes often cause post hoc tests to lose power even after significant ANOVA." />
Step 2: Run the ANOVA Test
Running an ANOVA test means breaking down your total data variance into parts and comparing them with an F-statistic.
This process is deeply rooted in specific research paradigms that prioritize empirical evidence and objective measurement.
One-Way ANOVA Example
Let's say you're comparing student test scores from three different teaching methods. After running the analysis, your software spits out a result like this: F(3, 56) = 17.66, p < .001
That tells you the variation between the teaching method groups is far larger than the random variation within them. The p-value being less than .001 means there’s a statistically significant difference; at least one group’s average score isn't the same as the others.
Two-Way ANOVA and Interactions
A two-way ANOVA lets you test two factors at once. For instance, you could look at both teaching method and student gender. Here, you’re checking for two things:
Main effects: Does teaching method, on its own, affect scores? Does gender, on its own, affect scores?
Interaction effects: Does the effect of the teaching method depend on gender? Maybe one method works much better for one group than the other.
Balanced vs. Unbalanced Designs
This part is about your sample sizes.
A balanced design has an equal number of observations in every group (e.g., 20 students in each teaching method).
An unbalanced design has unequal group sizes.
Balanced designs are simpler, more robust, and give you clearer results. Unbalanced designs can complicate the math, reduce your test's sensitivity (statistical power), and sometimes make interactions harder to spot.
For reliable business or research conclusions, a balanced setup is preferable. A piece in the Harvard Business Review on experimental design notes that balanced groups lead to more interpretable comparisons and help minimize bias.
Step 3: Understand Why Post Hoc Tests Are Needed

A significant ANOVA result only tells you that not all group means are equal. It doesn't tell you which specific groups differ from each other. To find out, you need to run comparisons between every possible pair of groups.
This creates a statistical problem. If you simply run a series of regular t-tests for each pair, you dramatically increase your chance of a false positive, finding a difference where none actually exists. This is called Type I error inflation.
Post hoc tests exist to solve this. They perform all those pairwise comparisons for you, but they adjust the significance level for each individual test to keep the overall error rate for the entire experiment at your chosen alpha level (usually 0.05).
What Post Hoc Tests Actually Do
Compare every group against every other group
Apply corrections to maintain a consistent overall error rate
Provide adjusted p-values you can trust
Help you interpret which differences are statistically meaningful
In practical terms, they let you dig deeper into your ANOVA results without inflating risk. You still get detailed comparisons, but with safeguards built in.
A Common Research Frustration
It's very common, and perfectly normal, to get a significant overall ANOVA result followed by post hoc tests that find no significant pairwise differences. This isn't a mistake or a contradiction. It usually means your study had limited statistical power.
Here’s what’s usually going on:
Limited statistical power: Your sample size may be too small to detect pairwise differences
Small effect sizes: The differences between groups exist, but they’re subtle
High within-group variability: Noise in the data makes it harder to isolate clear differences
So while the overall variation across groups is strong enough to detect, individual comparisons don’t quite pass the threshold once corrections are applied.
It’s a reminder that ANOVA and post hoc tests answer slightly different questions. One tells you if something is happening, the other tells you exactly where, and sometimes, the data just isn’t strong enough to pin that down cleanly.
<ProTip title="⚠️ Warning:" description="Do not run multiple t tests after ANOVA without correction methods." />
Step 4: Choose the Right Post Hoc Test
Picking the correct post hoc test is critical. For a deeper dive into the specific math behind these adjustments, you can explore this detailed resource on post hoc tests anova.
Comparison of Common Post Hoc Tests
Test | Best Use Case | Conservativeness | Key Feature |
Tukey HSD | Comparing all possible pairs of group means. | Moderate | Controls the familywise error rate for all pairwise comparisons. |
Bonferroni | When you have only a few, pre-planned comparisons. | Very High | Simple method: divides your alpha level (e.g., 0.05) by the number of tests. |
Dunnett | Comparing several treatment groups back to a single control group. | Moderate | More powerful than Tukey for this specific, focused purpose. |
Scheffé | Testing complex, unplanned contrasts (e.g., comparing the average of two groups to a third). | Extremely High | Very flexible but also very conservative, reducing power. |
Tukey HSD in Practice
Tukey's Honestly Significant Difference (HSD) is the default choice for most situations, especially when you have balanced designs (equal sample sizes).
It effectively controls the overall error rate while maintaining reasonable statistical power to find real differences.
Bonferroni Simplicity
The Bonferroni correction is simple to understand and apply: you take your desired alpha level and divide it by the number of comparisons you're making.
Its major drawback is that it becomes far too strict when you have many groups, making it very hard to find any significant result.
When to Use Games-Howell
If your Levene's test indicates unequal variances across groups, don't use Tukey or Bonferroni. Instead, use the Games-Howell test.
It doesn't assume equal variances and provides robust, reliable pairwise comparisons in these situations, preventing false conclusions.
<ProTip title="🧠 Note:" description="Match your post hoc test to your ANOVA design and data conditions." />
Step 5: Interpret Results Correctly
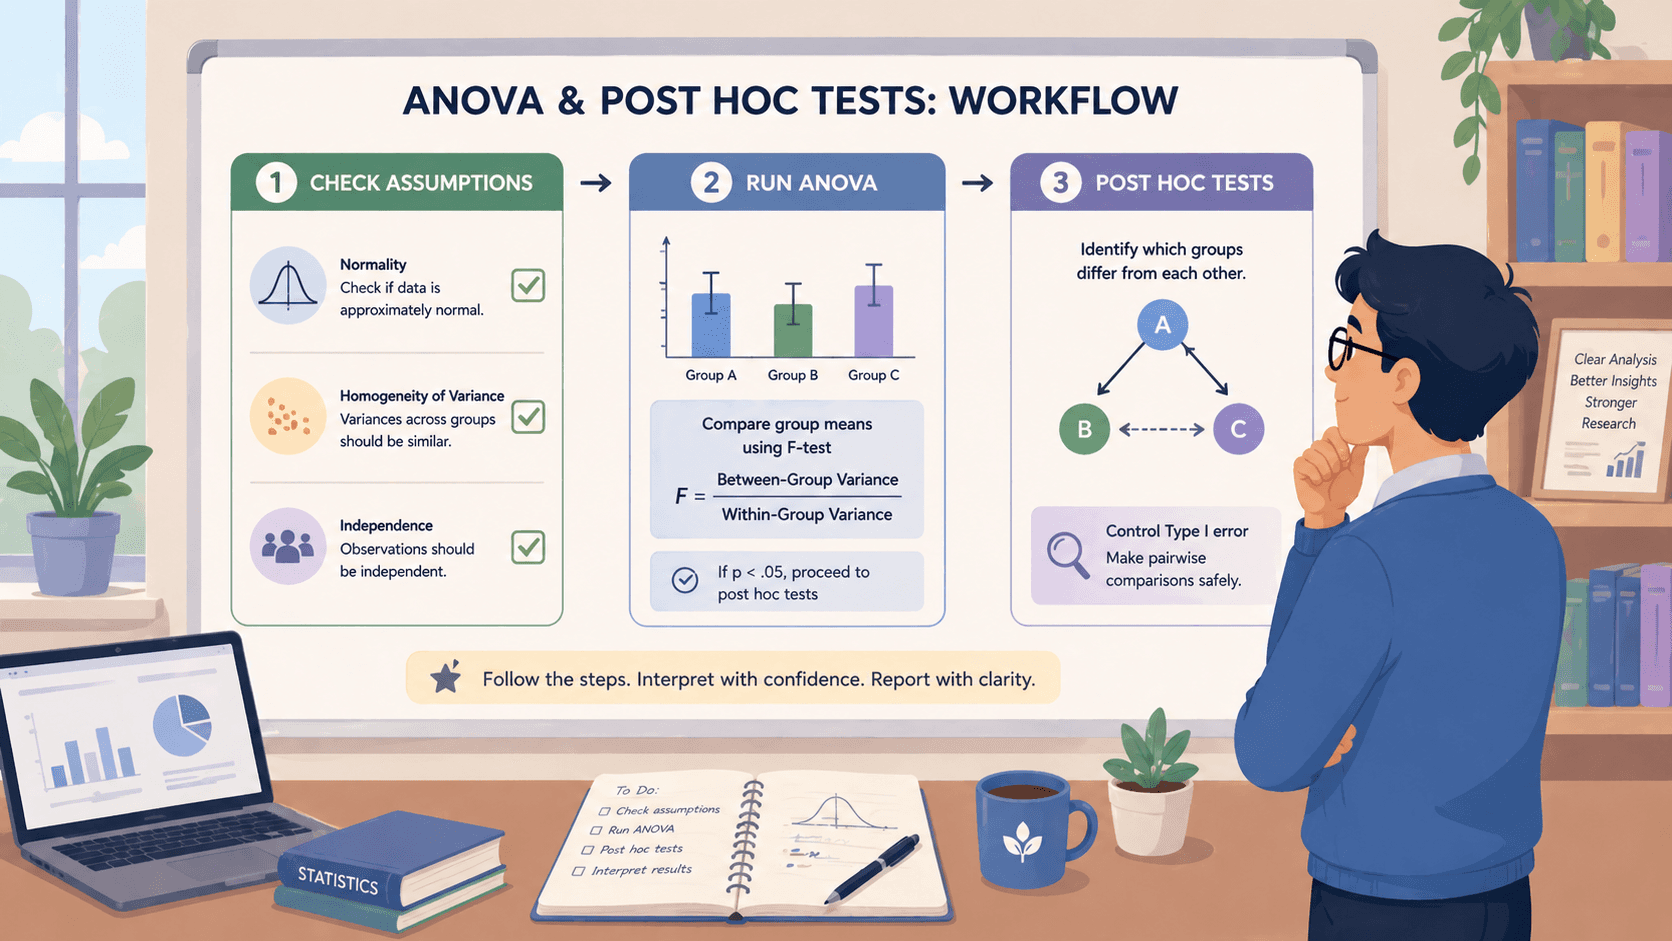
Reading your results means looking past just the p-values. A significant p-value tells you a difference is statistically detectable, but not whether it's large enough to matter in practice.
Focus on Pairwise Differences
This is the core output from your post hoc test. It will show you exactly which groups are different from each other. Your results might look like this:
Group A vs. Group B: p = .003 (Significant)
Group A vs. Group C: p = .015 (Significant)
Group B vs. Group C: p = .210 (Not Significant)
This tells you the treatment in Group A worked differently than B or C, but groups B and C performed similarly.
Include Effect Sizes
A p-value can be significant even if the actual difference between groups is tiny. Effect size measures the magnitude of that difference. Common measures for ANOVA are Eta squared (η²) or Partial Eta squared.
They tell you what proportion of the total variance is explained by your independent variable. A large, significant p-value with a tiny η² often means a trivial finding.
Confidence Intervals Matter
Always check the confidence intervals for the mean differences. A 95% CI gives you a plausible range for the true difference between two group means. A wide interval suggests uncertainty, even with a significant p-value.
An interval that doesn't include zero confirms significance, but its bounds show you the potential size of the effect, providing much more useful information than a p-value alone.
Step 6: Handle Advanced ANOVA Designs
Standard one-way ANOVA won't cover every research scenario. More complex designs are common and require specific approaches.
Repeated Measures ANOVA
Use this when you measure the same group of people or subjects multiple times under different conditions, like testing patient pain levels before, during, and after a treatment.
A key assumption here is sphericity, which you check with Mauchly’s test. If that test fails, you apply a correction to your degrees of freedom.
The two main corrections are the Greenhouse-Geisser (more conservative) and Huynh-Feldt (less conservative) corrections.
Mixed ANOVA Models
This design mixes between-subjects and within-subjects factors in the same analysis. For example, you might compare two different training programs (between-subjects) across four weekly assessments (within-subjects).
It's a powerful tool for longitudinal studies or experiments with a pre-test/post-test design across different groups.
Factorial ANOVA Designs
A factorial ANOVA is used when you have two or more independent variables (factors). A 2x2 design, for instance, lets you analyze the effect of Factor A, the effect of Factor B, and, critically, the interaction effect between A and B.
This is where you see if the effect of one variable depends on the level of the other, often providing the most interesting insights from your data.
Common Mistakes Researchers Make
The problems usually happen when people try to put theory into practice.
Making Things Too Complicated
A tangled research design muddies your findings and makes mistakes more likely. It's easy to end up with a model nobody can really understand, including you.
Only Looking at the P Value
Some papers just slap a p-value in the results section and call it a day. That doesn't tell you much about whether the finding actually matters in any practical sense.
Post-Hoc Tests Done Wrong
You can't just run a bunch of post-hoc comparisons if your initial ANOVA wasn't significant. And hunting through your data after the fact to find something that looks "significant" is a bad habit.
Not Checking Your Assumptions
This might be the most common slip-up. If you don't verify things like normality or equal variances, the whole analysis is built on shaky ground.
<ProTip title="🚀 Strategy:" description="Plan your contrasts before running ANOVA to avoid data fishing." />
When Your Results Need to Make Sense Fast
You’re staring at outputs, trying to figure out what matters, but the numbers can feel messy and hard to explain. It gets confusing. Without a clear approach, it’s easy to doubt your results or miss what the data is really saying.
<CTA title="Strengthen Your Statistical Workflow" description="Turn complex analysis into clear steps with guided writing and structured prompts." buttonLabel="Try Jenni Free" link="https://app.jenni.ai/register" />
That’s where Jenni can help you sort things out and present them in a way that feels clear. It supports how you write and explain your analysis so your findings hold together. Instead of guessing, you move forward with results that are easier to trust and share.